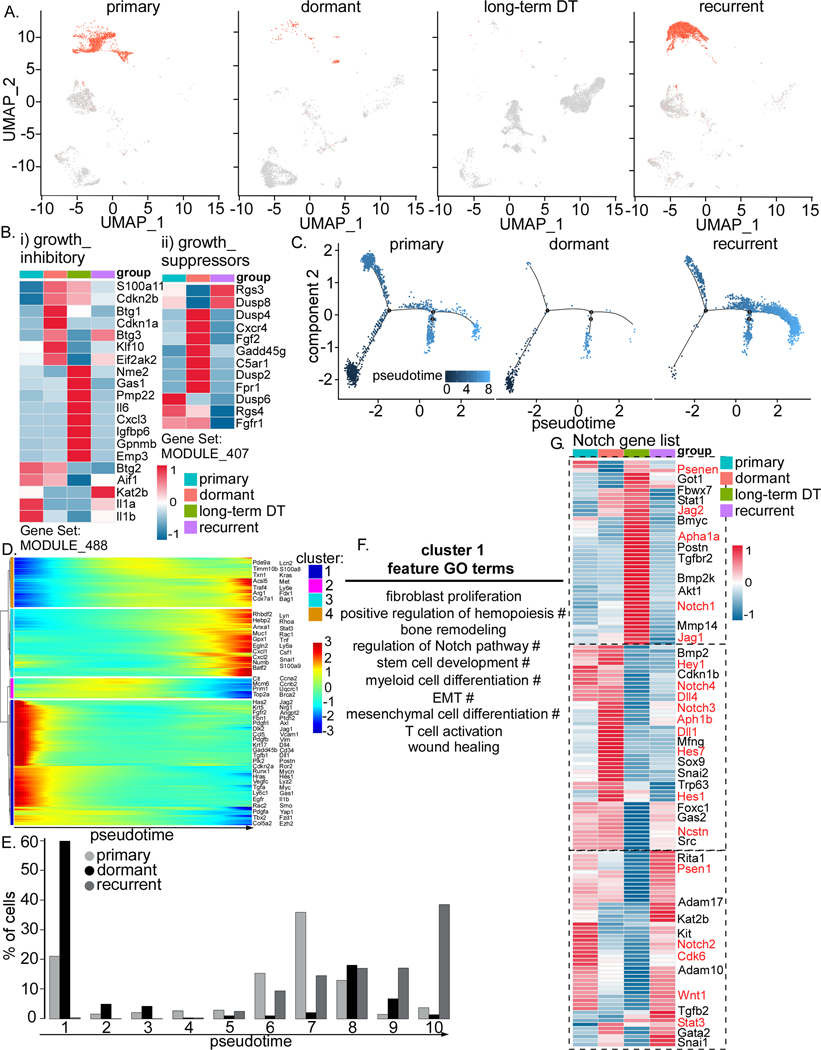
Figure 2. Tumor cells become quiescent (dormant) when regressed.
A) UMAP projection of GFP+ cells in Wnt/iFGFRGFP tumors at primary, dormant, long-term DT, and recurrence. B) Heatmap showing expression of growth inhibitory (i) and growth suppressor (ii) genes in different tumor samples. C) Trajectory analysis of cancer cells in 3 tumor samples, primary, dormant and recurrence. D) Heatmap showing 4 clusters of genes differentially expressed along the trajectory in C. E) Bar graph with 10 bins of pseudotime showing cells in the dormant stage mainly emerge in the early stage (bin #1). F) Feature Gene Ontology (GO) terms enriched in cluster1. The # symbol designates pathways regulated by Jagged-1 and Notch. G) Heatmap showing expression of the Notch pathway in different tumor samples. Known Notch pathway genes are highlighted in red.

