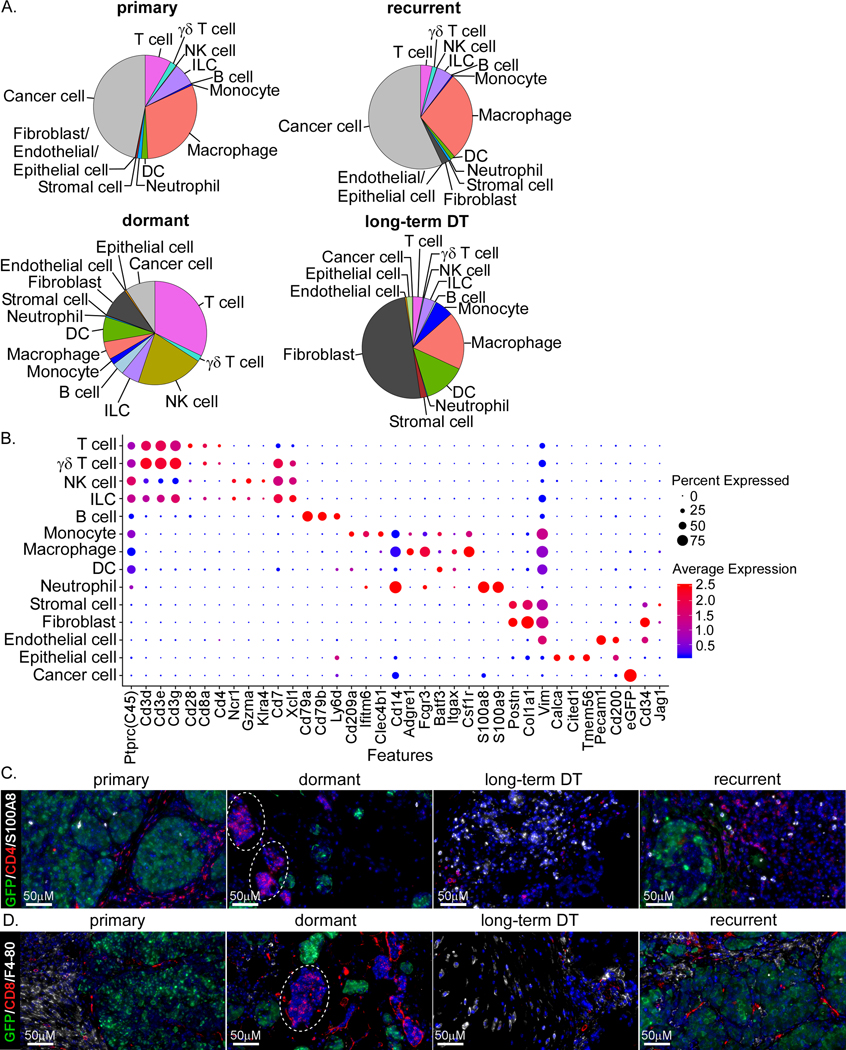
Figure 3. Immune cells and microenvironment change during tumor dormancy.
A) Pie chart showing contributions of major distinct cell types in four tumor samples. B) Dot plot of canonical marker genes for different cell types. C and D) Staining of some immune cell markers, CD4+ T cells (CD4), CD8+ T cells (CD8), macrophages (F4–80), and MDSCs (S100A8), and GFP in different tumor samples.

