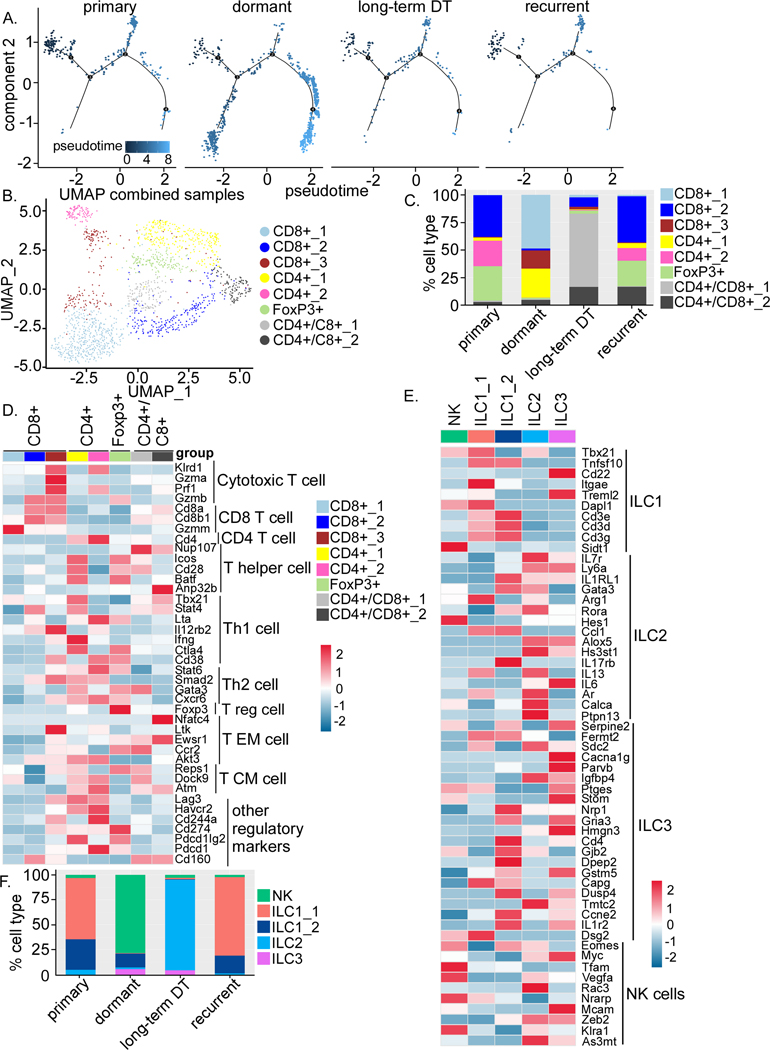
Figure 5. Dormancy is associated with remodeling of the lymphoid compartment.
A) Trajectory analysis of T cells at different stages. B) UMAP plot of T cells demonstrating distinct clusters. C) Bar graph quantifying the percentage of different clusters within T cells at different stages. D) Heatmap showing expression of known genes involved in different subtype of T cells and some regulatory genes. E) Heatmaps showing expression of NK cells and 4 distinct clusters of ILCs. F) Bar graph showing the changes in the percentage of NK cells and 4 distinct clusters of ILCs in different tumor samples.

