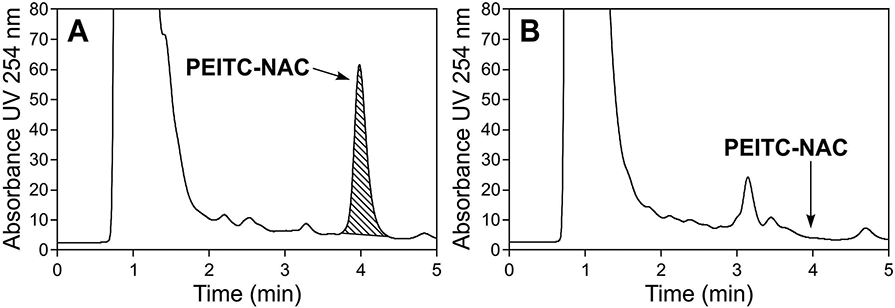
Figure 3.

HPLC chromatograms of urine samples. The samples were obtained from a subject who consumed the watercress-containing drink (A), and the same subject during the washout period (B). The arrows indicate the peak for the PEITC metabolite PEITC-NAC in panel A and the lack of this peak in panel B.
