
Figure 2.
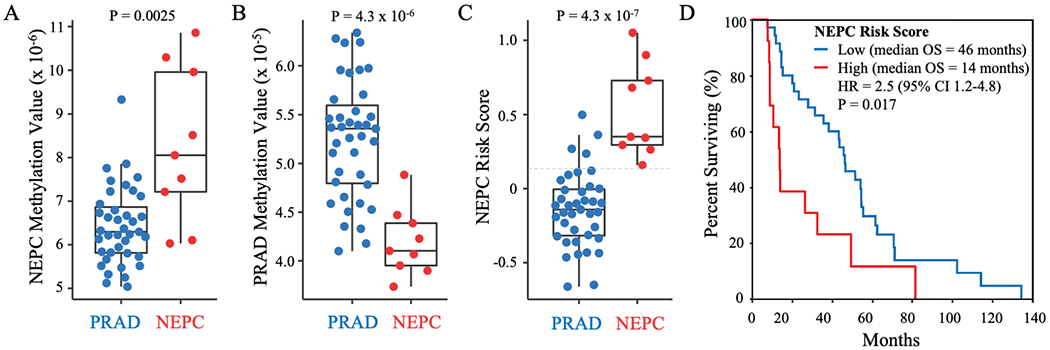
Classification of NEPC and PRAD samples in the cfDNA test cohort. NEPC Methylation Values (A), PRAD Methylation Values (B), and NEPC Risk Scores (C) in cfDNA samples from men with PRAD or NEPC in the test cohort. P-Values calculated using a two-sided Wilcoxon rank-sum test. Optimal cut-off (indicated by dotted gray line) was determined in this cohort using Youden’s J statistic. D) Kaplan-Meier curve for overall survival (OS) from the time of metastatic disease for men with high (>0.15) versus low (≤0.15) NEPC Risk Score relative to the cut-off.