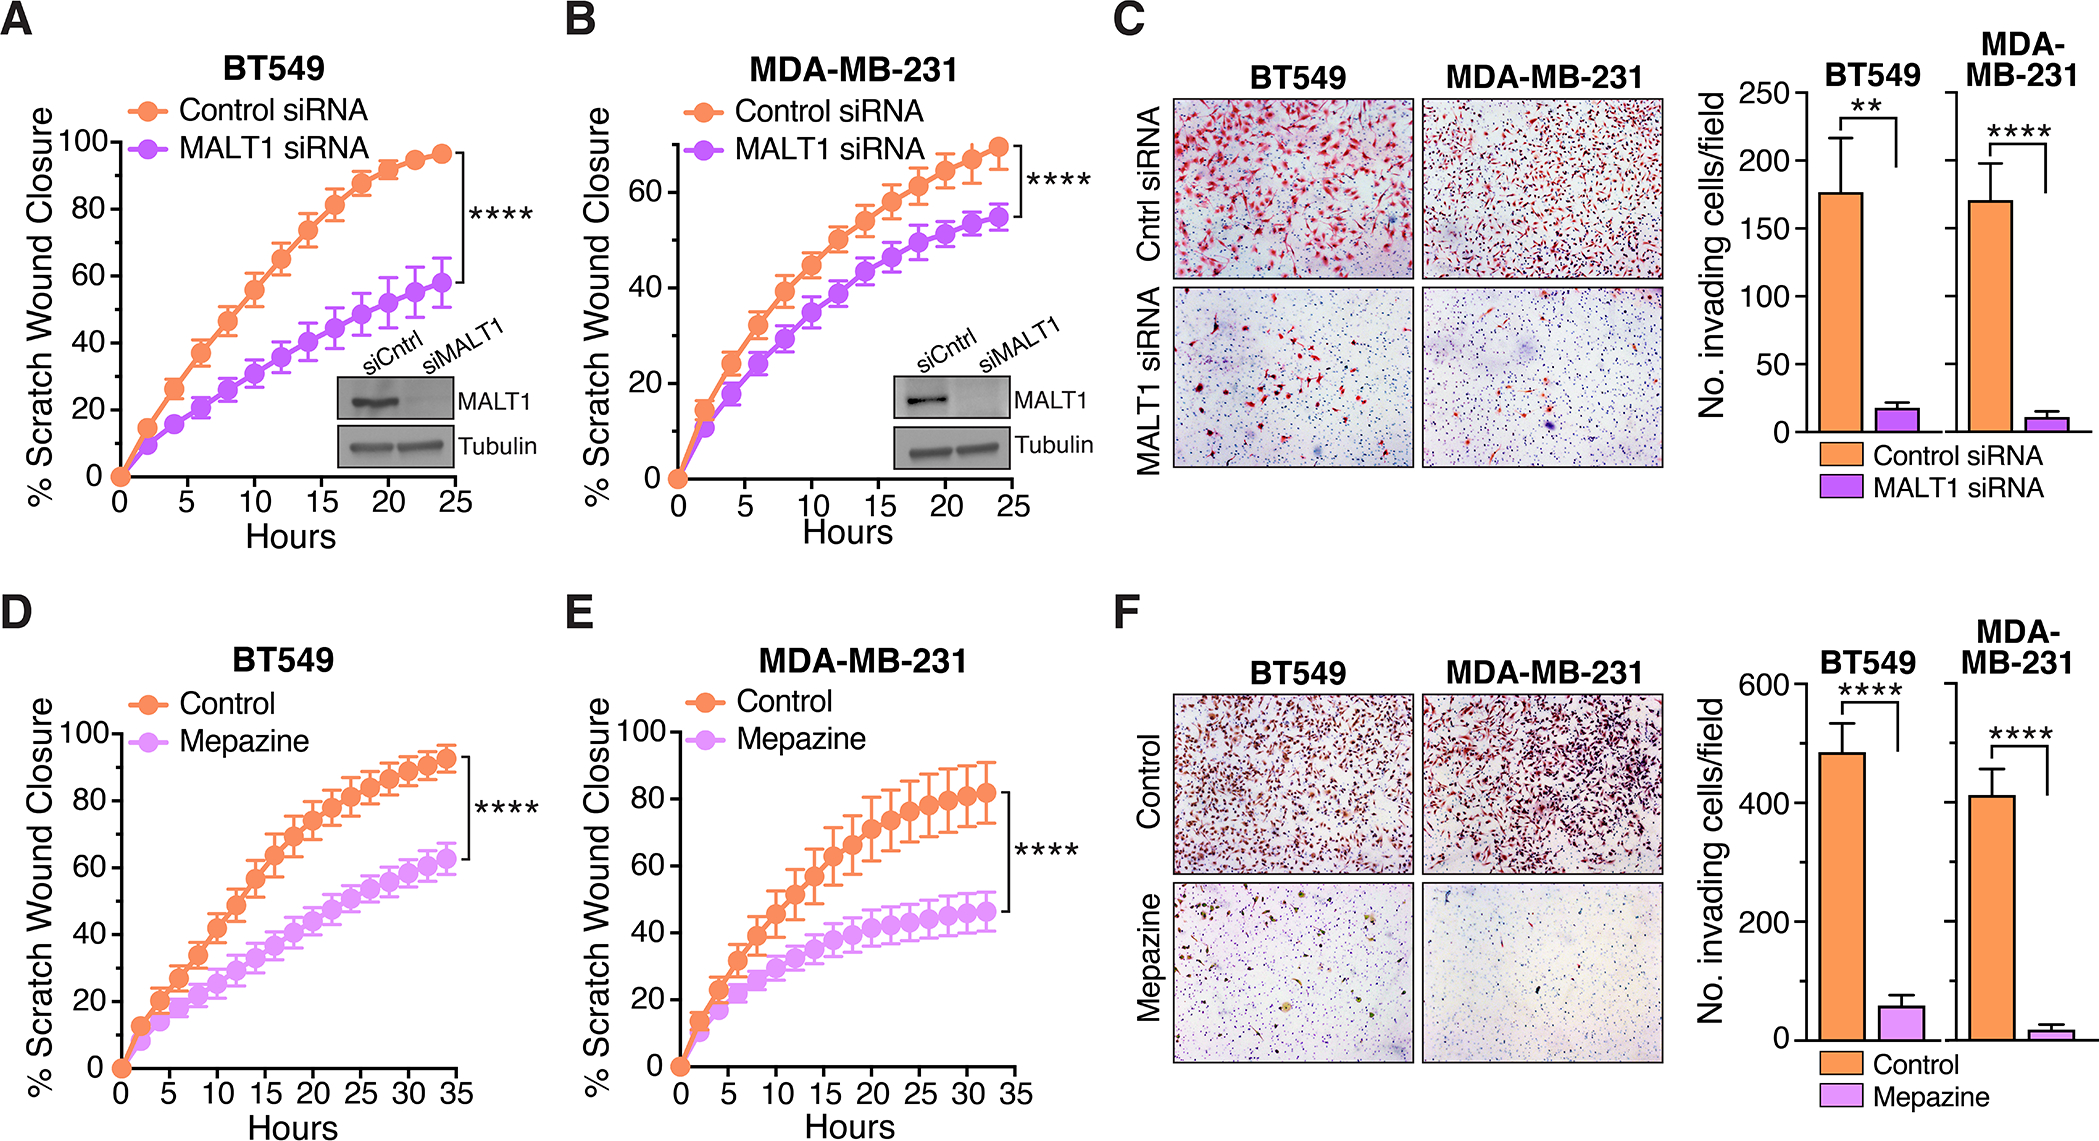
Figure 4. Inhibiting MALT1 effectively blocks migration and invasion of GPCR+ breast cancer cells.

A and B, Effect of MALT1 knockdown on migration of BT549 (A) and MDA-MB-231 (B) cells in the scratch wound assay. Quantification of scratch would closure is plotted as a continuous function of time (mean ± SD, n=8–10), ****, P < 0.0001, two-way ANOVA. The degree of MALT1 knockdown is shown in representative immunoblot inserts. C, Effect of MALT1 knockdown on BT549 and MDA-MB-231 cell invasiveness, as measured using matrigel-coated Boyden chambers. Representative images of invaded cells are shown at left. Quantification of cell invasion is shown at right (mean ± SEM, n=12), **, P < 0.01; ****, P < 0.0001, two-tailed t test with Welch’s correction. D and E, Effect of mepazine (10 μM) on migration of BT549 (D) and MDA-MB-231 (E) cells in the scratch wound assay. Quantification of scratch would closure is plotted as a continuous function of time (mean ± SD, n=8–12), ****, P < 0.0001, two-way ANOVA. F, Effect of mepazine (10 μM) on BT549 and MDA-MB-231 cell invasiveness, as measured using matrigel-coated Boyden chambers. Representative images of invaded cells are shown at left. Quantification of cell invasion is shown at right (mean ± SEM, n=12–13), ****, P < 0.0001, two-tailed t test with Welch’s correction.
