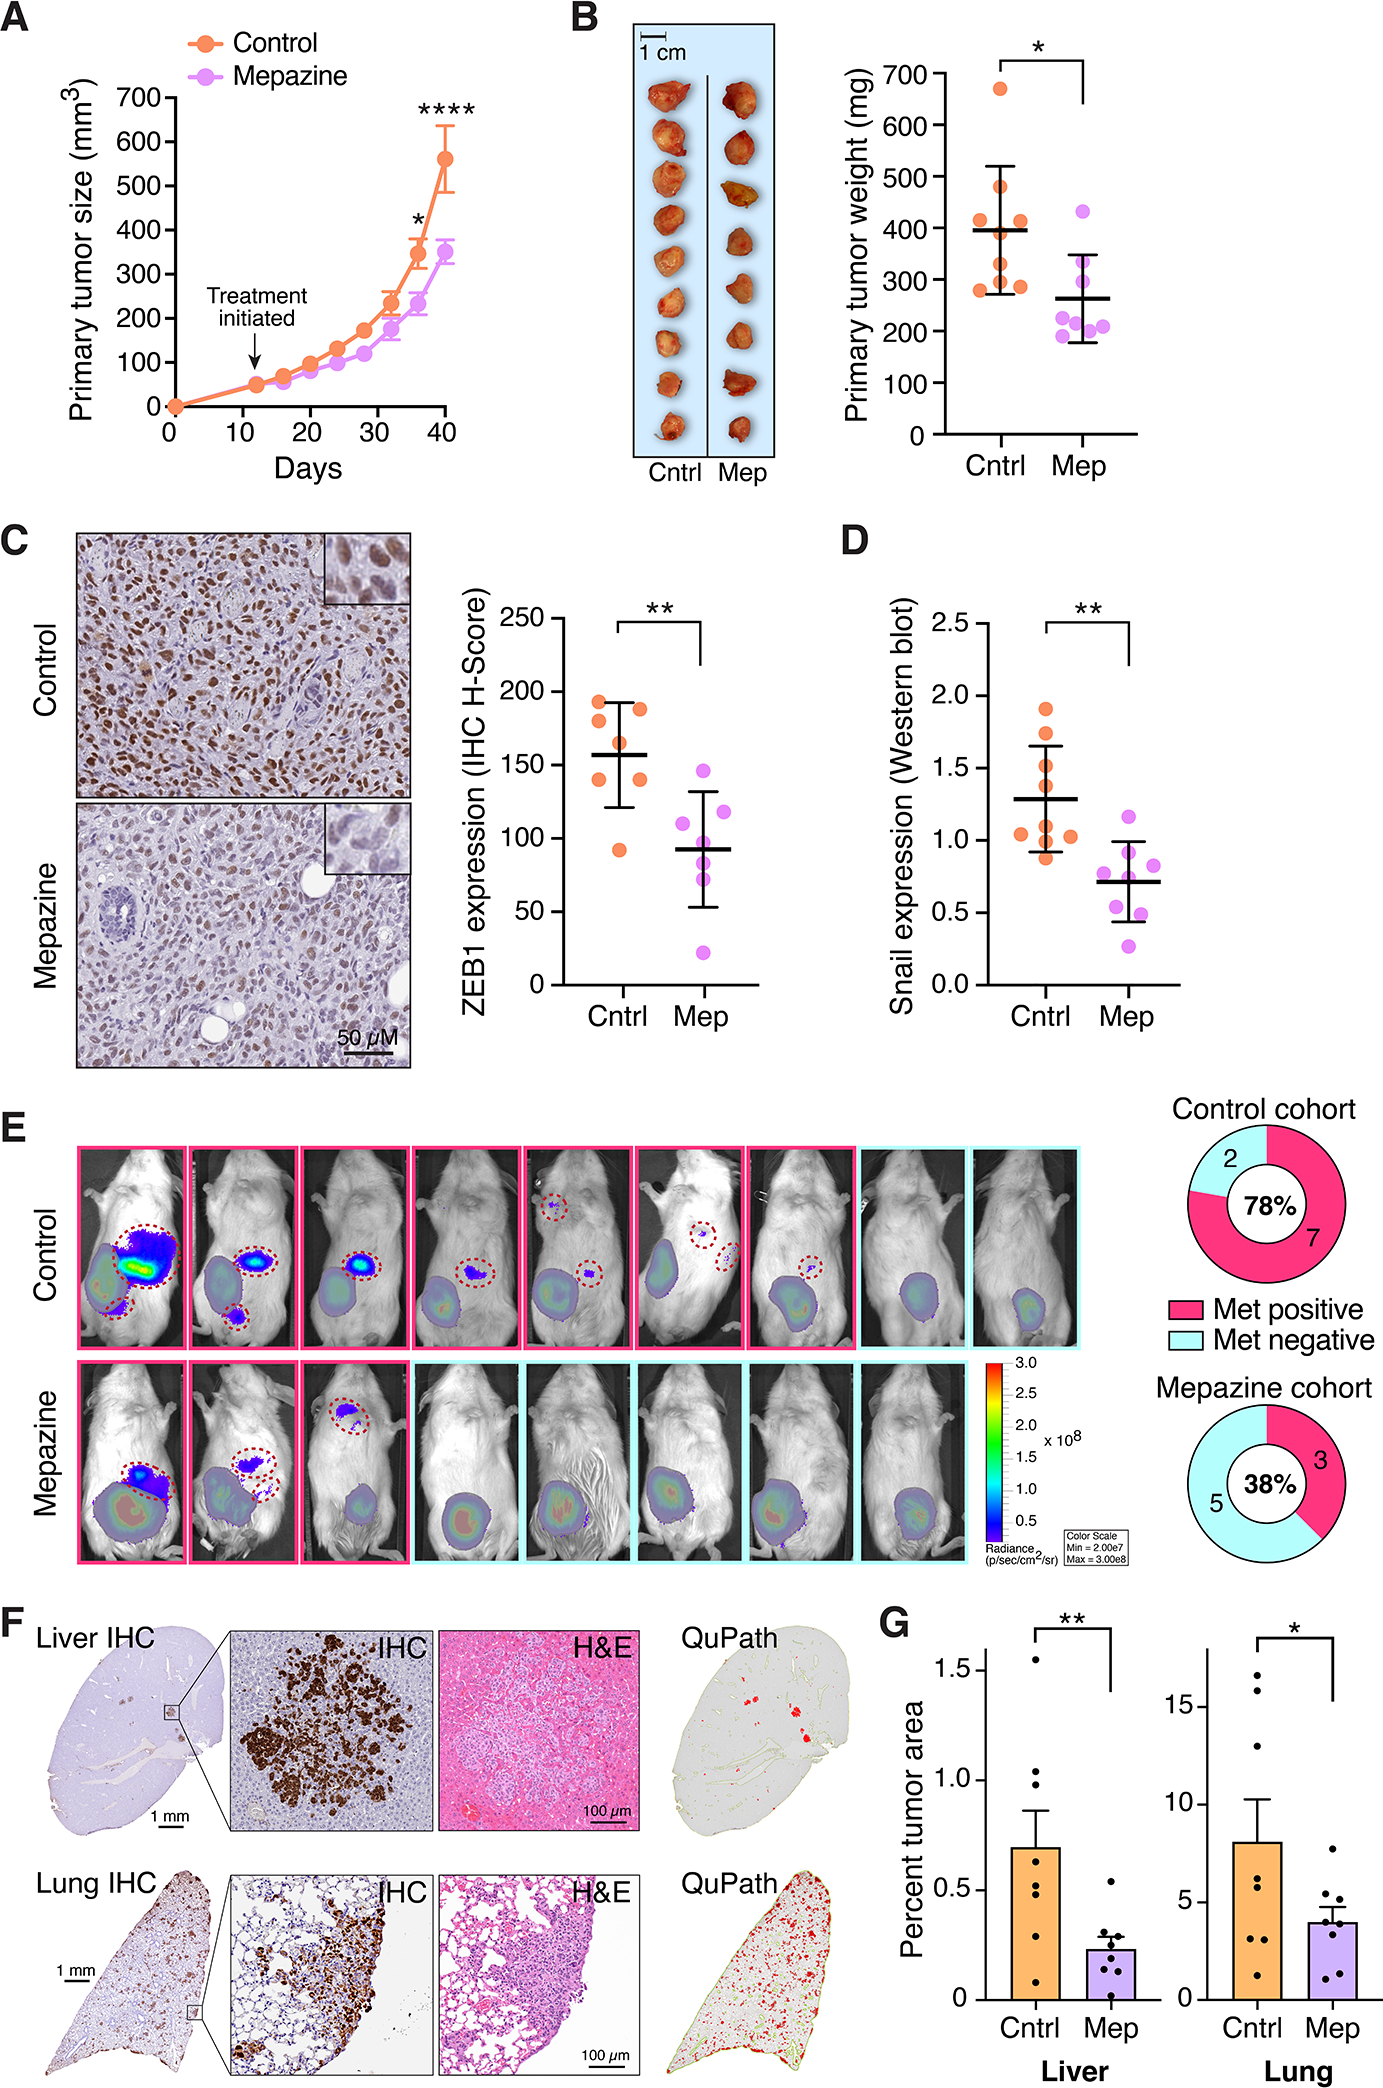
Figure 5. MALT1 inhibition abrogates metastasis of GPCR+ breast cancer xenografts.

A and B, Effect of mepazine on growth of MDA-MB-231 orthotopic xenografts in NSG mice. Daily IP injections of 5% DMSO vehicle or mepazine (16 mg/kg) were initiated when tumors reached ~50 mm3. Tumor size was measured over time with calipers (mean ± SEM, n=8–9), *, P < 0.05; ****, P < 0.0001, two-way ANOVA with Sidak’s correction for multiple comparisons (A). Excised tumors were weighed at 40 days (mean ± SD, n=8–9), *, P < 0.05, two-tailed t test with Welch’s correction (B). C, Effect of mepazine on nuclear ZEB1 expression in xenografts, as measured by immunohistochemical staining and quantitative image analysis. Representative images are shown at left; ZEB1 quantification is shown at right and expressed as H-score (mean ± SD, n=7), **, P <0.01, two-tailed t test. D, Effect of mepazine on Snail expression in xenograft lysates, as measured by western blot analysis. Snail band intensity for each sample was normalized to β-actin (mean ± SD, n=8–9), **, P < 0.01, two-tailed t test. E, Representative IVIS images of the same MDA-MB-231 xenografts described in panels A and B, immediately prior to tumor harvesting. Signals from primary tumors are covered by a grayed out pseudo-mask to highlight the presence of tumor cell signals emanating from lesions that represent either distant metastases or the spread of tumors outside the confines of the mammary fat pad (individual metastatic lesions are identified by hashed red circles). Quantification of the proportion of mice with metastatic spread is shown at right. F, Representative photomicrographs of liver and lung sections from a control-treated NSG mouse, 40 days after orthotopic implantation with MDA-MB-231 cells in the mammary fat pad. Immunohistochemical (IHC) stains using a vimentin/Ki-67 cocktail are shown alongside corresponding H&E stains. QuPath image conversions of the IHC stains, generated to annotate and quantify micrometastatic lesions, are shown at right. G, QuPath quantification of micrometastatic tumor burden in liver and lung, for all mice included in the study (mean ± SEM, n=8, *, P<0.05; **, P <0.05, one-tailed t test. Cntrl, control-treated; Mep, Mepazine-treated.
