
Figure 6.
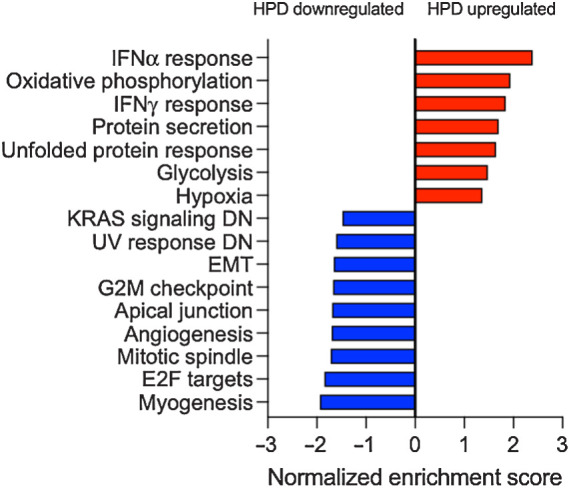
GSEA of pathways associated with HPD as compared with PD. RNA-seq was performed on baseline tumor biopsies. Bars are a summary of results from GSEA plots with the gene set names from Hallmark pathways and the normalized enrichment score. Positive enrichment score represents pathways that were correlated with HPD while negative enrichment score represents those that were correlated with PD. All gene sets shown had an adjusted P value < 0.05. IFN, interferon.