. 2022 Mar 3;10(3):303–313. doi: 10.1158/2326-6066.CIR-21-1083

Figure 2.

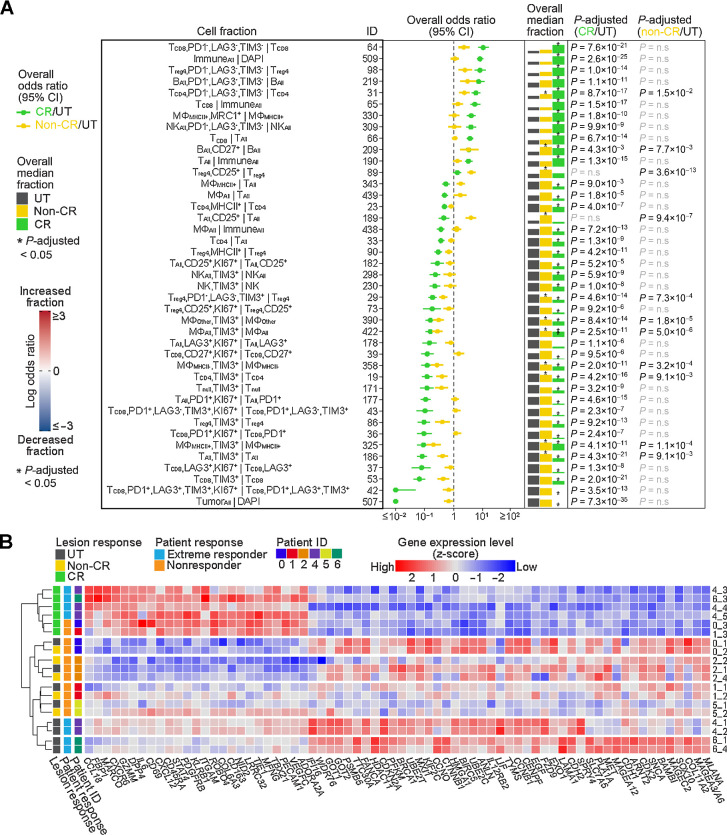
Figure 2. Immune-cell states and gene-expression signatures following tumor-cell eradication by IL2. A, Shown are cell fractions (rows) with significant changes following IL2 injection. The forest plot shows the overall effect size (odds ratio) and 95% confidence interval (CI) of each cell fraction across all patients for CR (n = 101 FOV) versus untreated (n = 112 FOVs) and non-CR (n = 120 FOVs) versus untreated. The overall median fraction, scaled to 1 for the largest fraction, is shown for untreated, non-CR, and CR lesions. Significant results, determined using a two-sided Wilcoxon test adjusted by Bonferroni correction, are indicated with an asterisk above the median fraction with P-adjusted noted (n.s., not significant). See also Supplementary Table S6. See Supplementary Table S3 for full cell type names. B, The heatmap indicates scaled RNA expression values for differentially expressed genes (P-adjusted < 0.0001) in CR (n = 6) versus untreated (n = 9) and/or non-CR (n = 5) versus untreated, sorted by CR versus untreated fold change. See also Supplementary Table S9.

Immune-cell states and gene-expression signatures following tumor-cell eradication by IL2. A, Shown are cell fractions (rows) with significant changes following IL2 injection. The forest plot shows the overall effect size (odds ratio) and 95% confidence interval (CI) of each cell fraction across all patients for CR (n = 101 FOV) versus untreated (n = 112 FOVs) and non-CR (n = 120 FOVs) versus untreated. The overall median fraction, scaled to 1 for the largest fraction, is shown for untreated, non-CR, and CR lesions. Significant results, determined using a two-sided Wilcoxon test adjusted by Bonferroni correction, are indicated with an asterisk above the median fraction with P-adjusted noted (n.s., not significant). See also Supplementary Table S6. See Supplementary Table S3 for full cell type names. B, The heatmap indicates scaled RNA expression values for differentially expressed genes (P-adjusted < 0.0001) in CR (n = 6) versus untreated (n = 9) and/or non-CR (n = 5) versus untreated, sorted by CR versus untreated fold change. See also Supplementary Table S9.