. 2022 Mar 3;10(3):303–313. doi: 10.1158/2326-6066.CIR-21-1083

Figure 3.

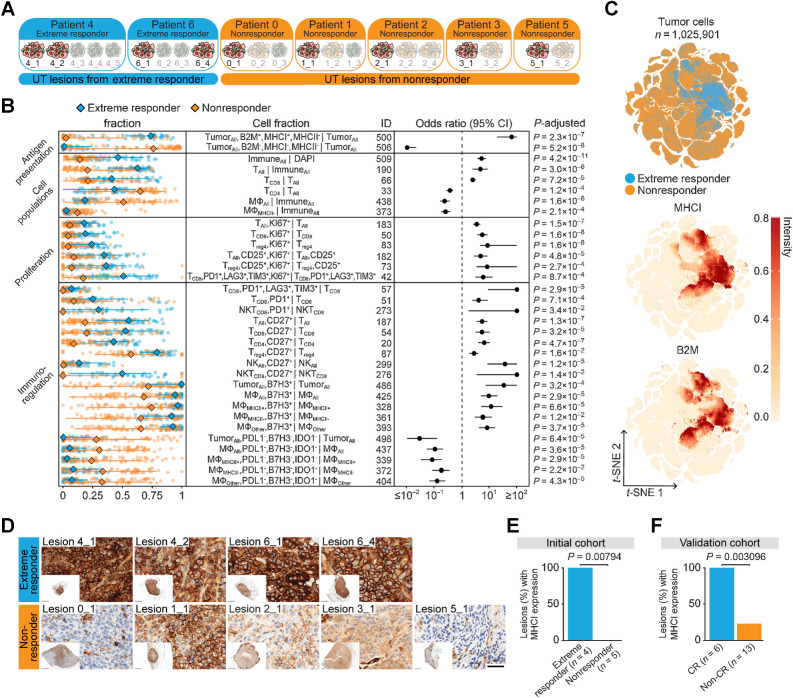
Figure 3. Pretreatment tumor MHC I expression is associated with complete tumor response to IL2. A, Grouping of untreated (UT) lesions from extreme responder and non-/mixed responder patients (labeled “non-responder” throughout figures). B, Shown are cell fractions (rows) with significant differences in untreated lesions from extreme responders (n = 38 FOV) versus non-/mixed responders (n = 74 FOVs). Left, fractions in each FOV, with overall median, minimum, and maximum (each point represents an FOV). The forest plot shows effect size (odds ratio) and 95% CI of each cell fraction with P-adjusted noted (two-sided Wilcoxon test adjusted by Bonferroni correction). See also Supplementary Table S10. See Supplementary Table S3 for full cell type names. C, t-SNE of untreated lesion tumor cells colored by patient response and normalized intensity of MHC I and B2M. D, MHC I IHC of untreated lesions (scale bar, 50 μm). E and F, Bar graphs showing the percentage of untreated lesions with expression of membranous MHC I in greater than 75% of tumor cells in the initial cohort (E; extreme responder, n = 4; nonresponder, n = 5) and in the validation cohort (F; CR, complete responder, n = 6; non-CR, noncomplete responder, n = 13) based on IHC staining (Fisher exact test, two-sided, exact P value noted).

Pretreatment tumor MHC I expression is associated with complete tumor response to IL2. A, Grouping of untreated (UT) lesions from extreme responder and non-/mixed responder patients (labeled “non-responder” throughout figures). B, Shown are cell fractions (rows) with significant differences in untreated lesions from extreme responders (n = 38 FOV) versus non-/mixed responders (n = 74 FOVs). Left, fractions in each FOV, with overall median, minimum, and maximum (each point represents an FOV). The forest plot shows effect size (odds ratio) and 95% CI of each cell fraction with P-adjusted noted (two-sided Wilcoxon test adjusted by Bonferroni correction). See also Supplementary Table S10. See Supplementary Table S3 for full cell type names. C,t-SNE of untreated lesion tumor cells colored by patient response and normalized intensity of MHC I and B2M. D, MHC I IHC of untreated lesions (scale bar, 50 μm). E and F, Bar graphs showing the percentage of untreated lesions with expression of membranous MHC I in greater than 75% of tumor cells in the initial cohort (E; extreme responder, n = 4; nonresponder, n = 5) and in the validation cohort (F; CR, complete responder, n = 6; non-CR, noncomplete responder, n = 13) based on IHC staining (Fisher exact test, two-sided, exact P value noted).