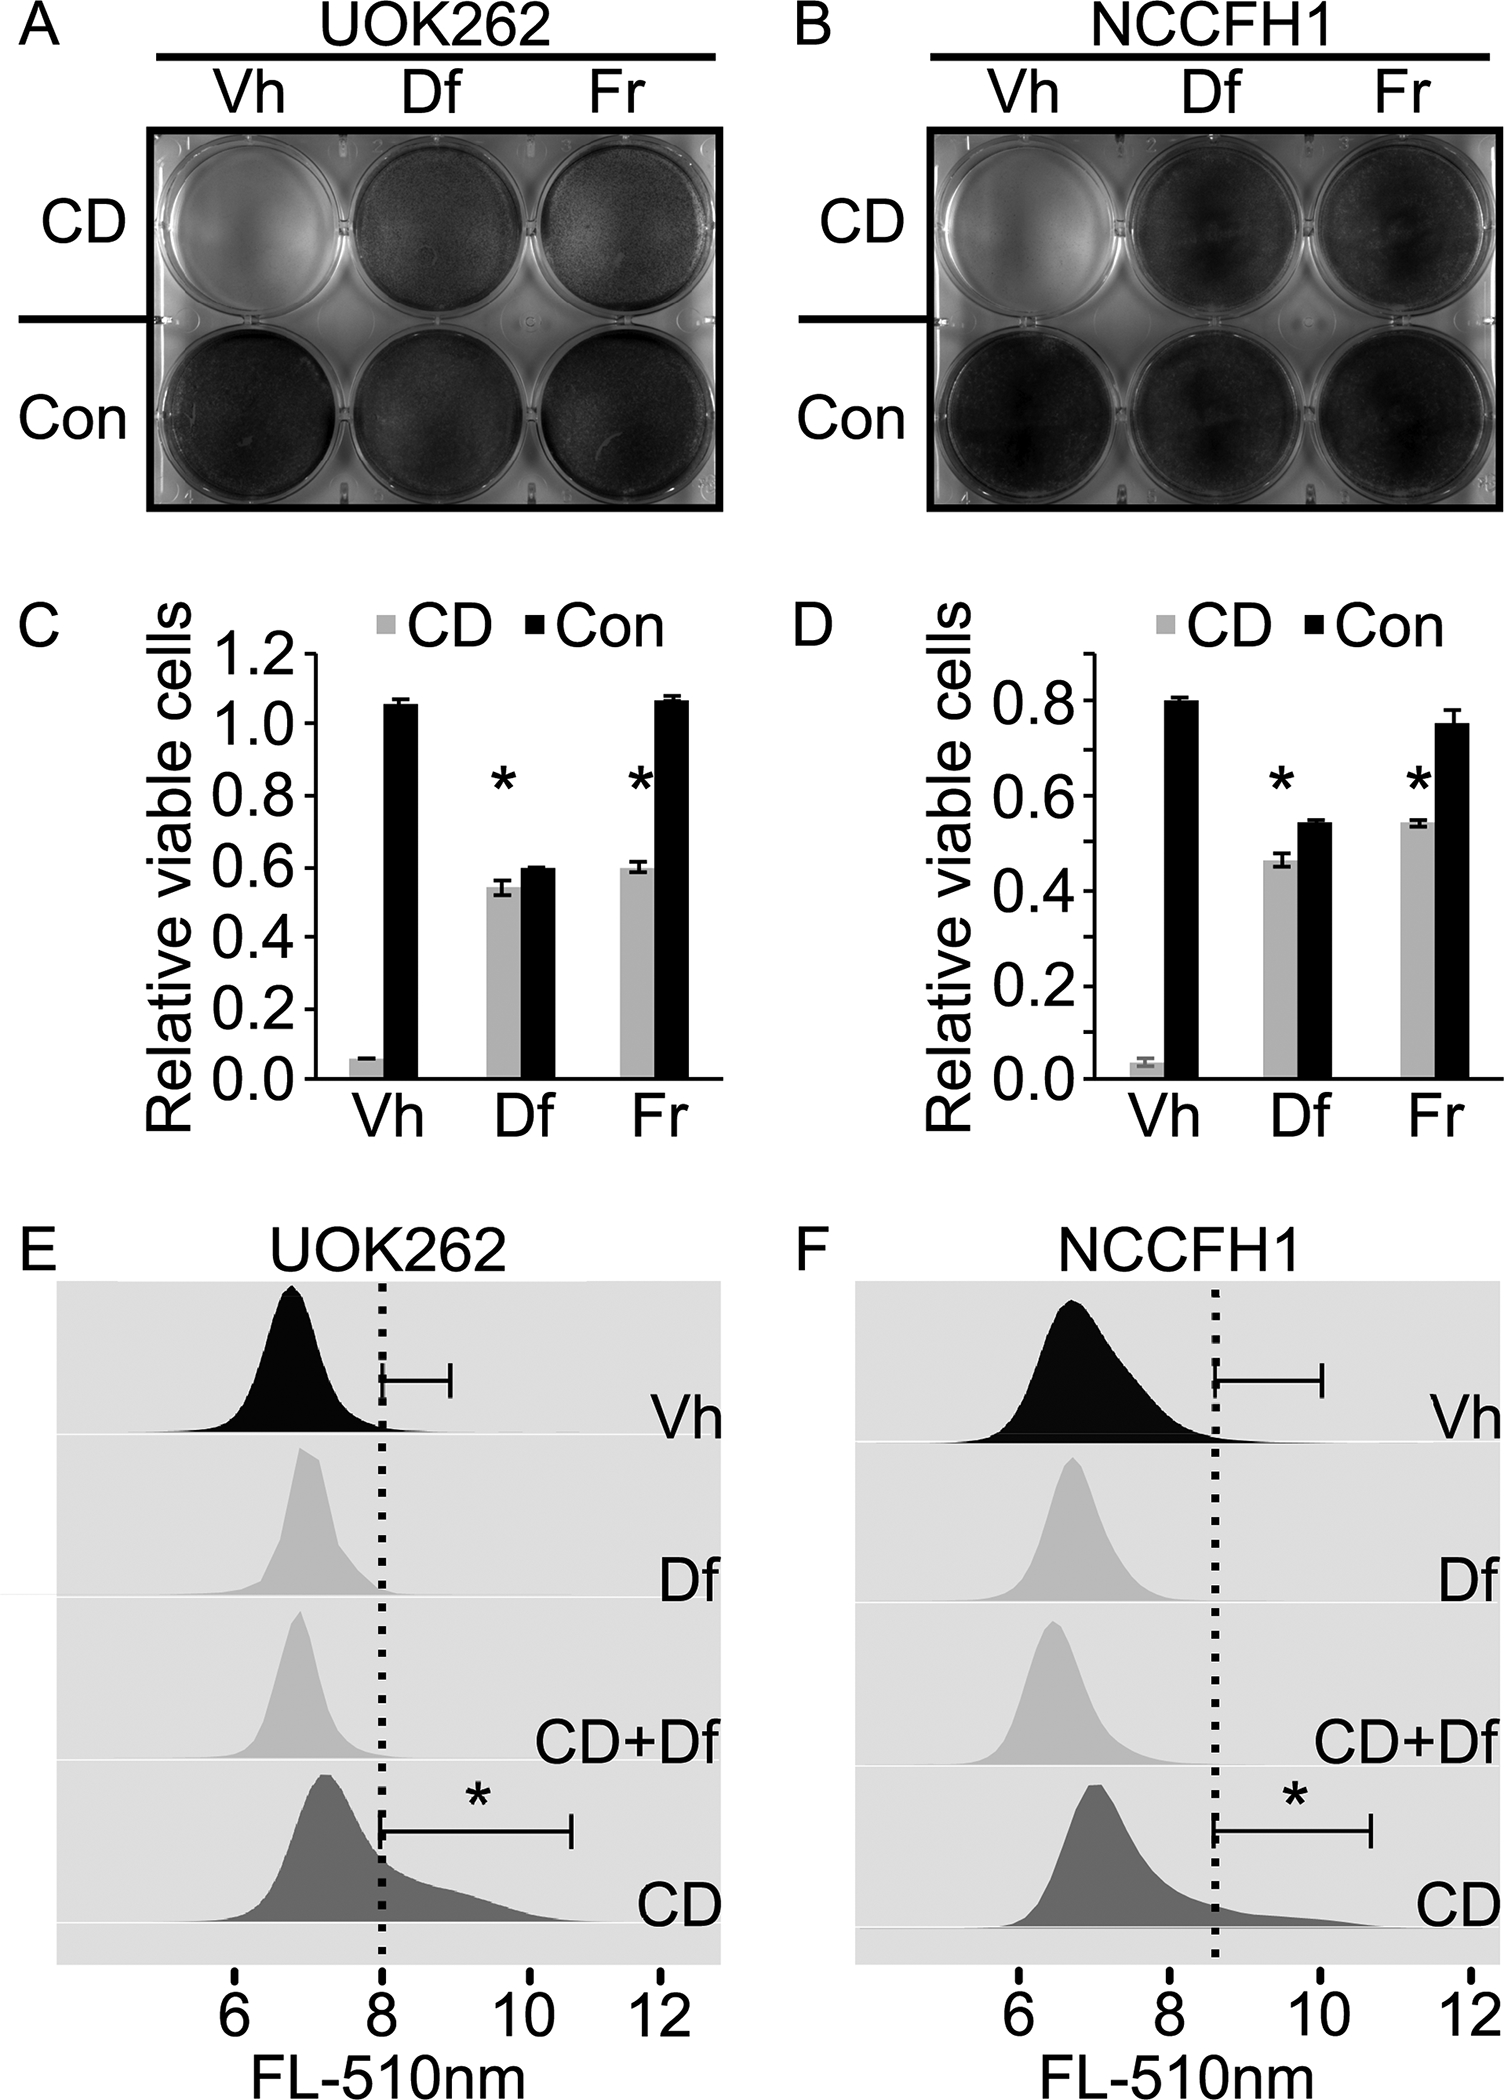
Figure 1. Cysteine deprivation induces ferroptosis in HLRCC cells.

A. Cysteine deprivation (CD) induces UOK262 cell death. Deferroxamine (Df) and ferrostatin (Fr) abrogate the cell killing effects of CD, indicating ferroptosis as the cell death mechanism. Equal number of UOK262 cells were seeded onto a 6-well plate. At 24 hours post seeding, media in the top row (3 wells) were replaced with cysteine free RPMI1640 supplemented with 5% FBS. Media in the bottom row (3 wells) were replaced with complete RPMI1640 supplemented with 5% FBS. Deferroxamine (Df) was spiked into the wells in the middle column (middle two wells) to a final concentration of 100μM. Ferrostatin (Fr) was spiked into the last column (last two wells) to a final concentration of 1μM. Vehicle (Vh) consisting of DMSO was spiked into the wells in the first column to a final concentration of 0.1%. Cells were fixed and stained with crystal violet at 24 hours post treatment. B. CD induces ferroptotic cell death in NCCFH1 cells. Experiment described in A was repeated with a different HLRCC cell line, NCCFH1. C and D. Quantitative measurement of viable cells following experiments similar to those described in A and B. Cells remain adhered to the 6-well plate were stained with crystal violet. After that, the stained cells were dissolved in 1% SDS and subjected to absorbance measurement at 590nm. Bar heights and error bars indicate means and standard deviations respectively. These statistics were calculated from two independent experiments. Each of those two independent experiments contained three technical replicates. Statistical significance was determined through two-way ANOVA followed by Tukey Honest Significant Differences. An asterisk, *, indicates a p-value < 0.05 when compared to the corresponding Vh control group. E and F. Cysteine deprivation increases lipid peroxidation rate in HLRCC cells. Df rescues the CD-induced increase in lipid peroxidation. Experiments described in A and B were repeated. Instead of measuring the remaining viable cells as the end point, lipid peroxidation rates were measured using a C11-Bodipy-flow cytometry method. Flow cytometry data generated were analyzed and visualized using flowCore and flowWiz packages in R statistical environment. Statistical significance was determined through Student’s t-test. An asterisk, *, indicates a p-value < 0.05.
