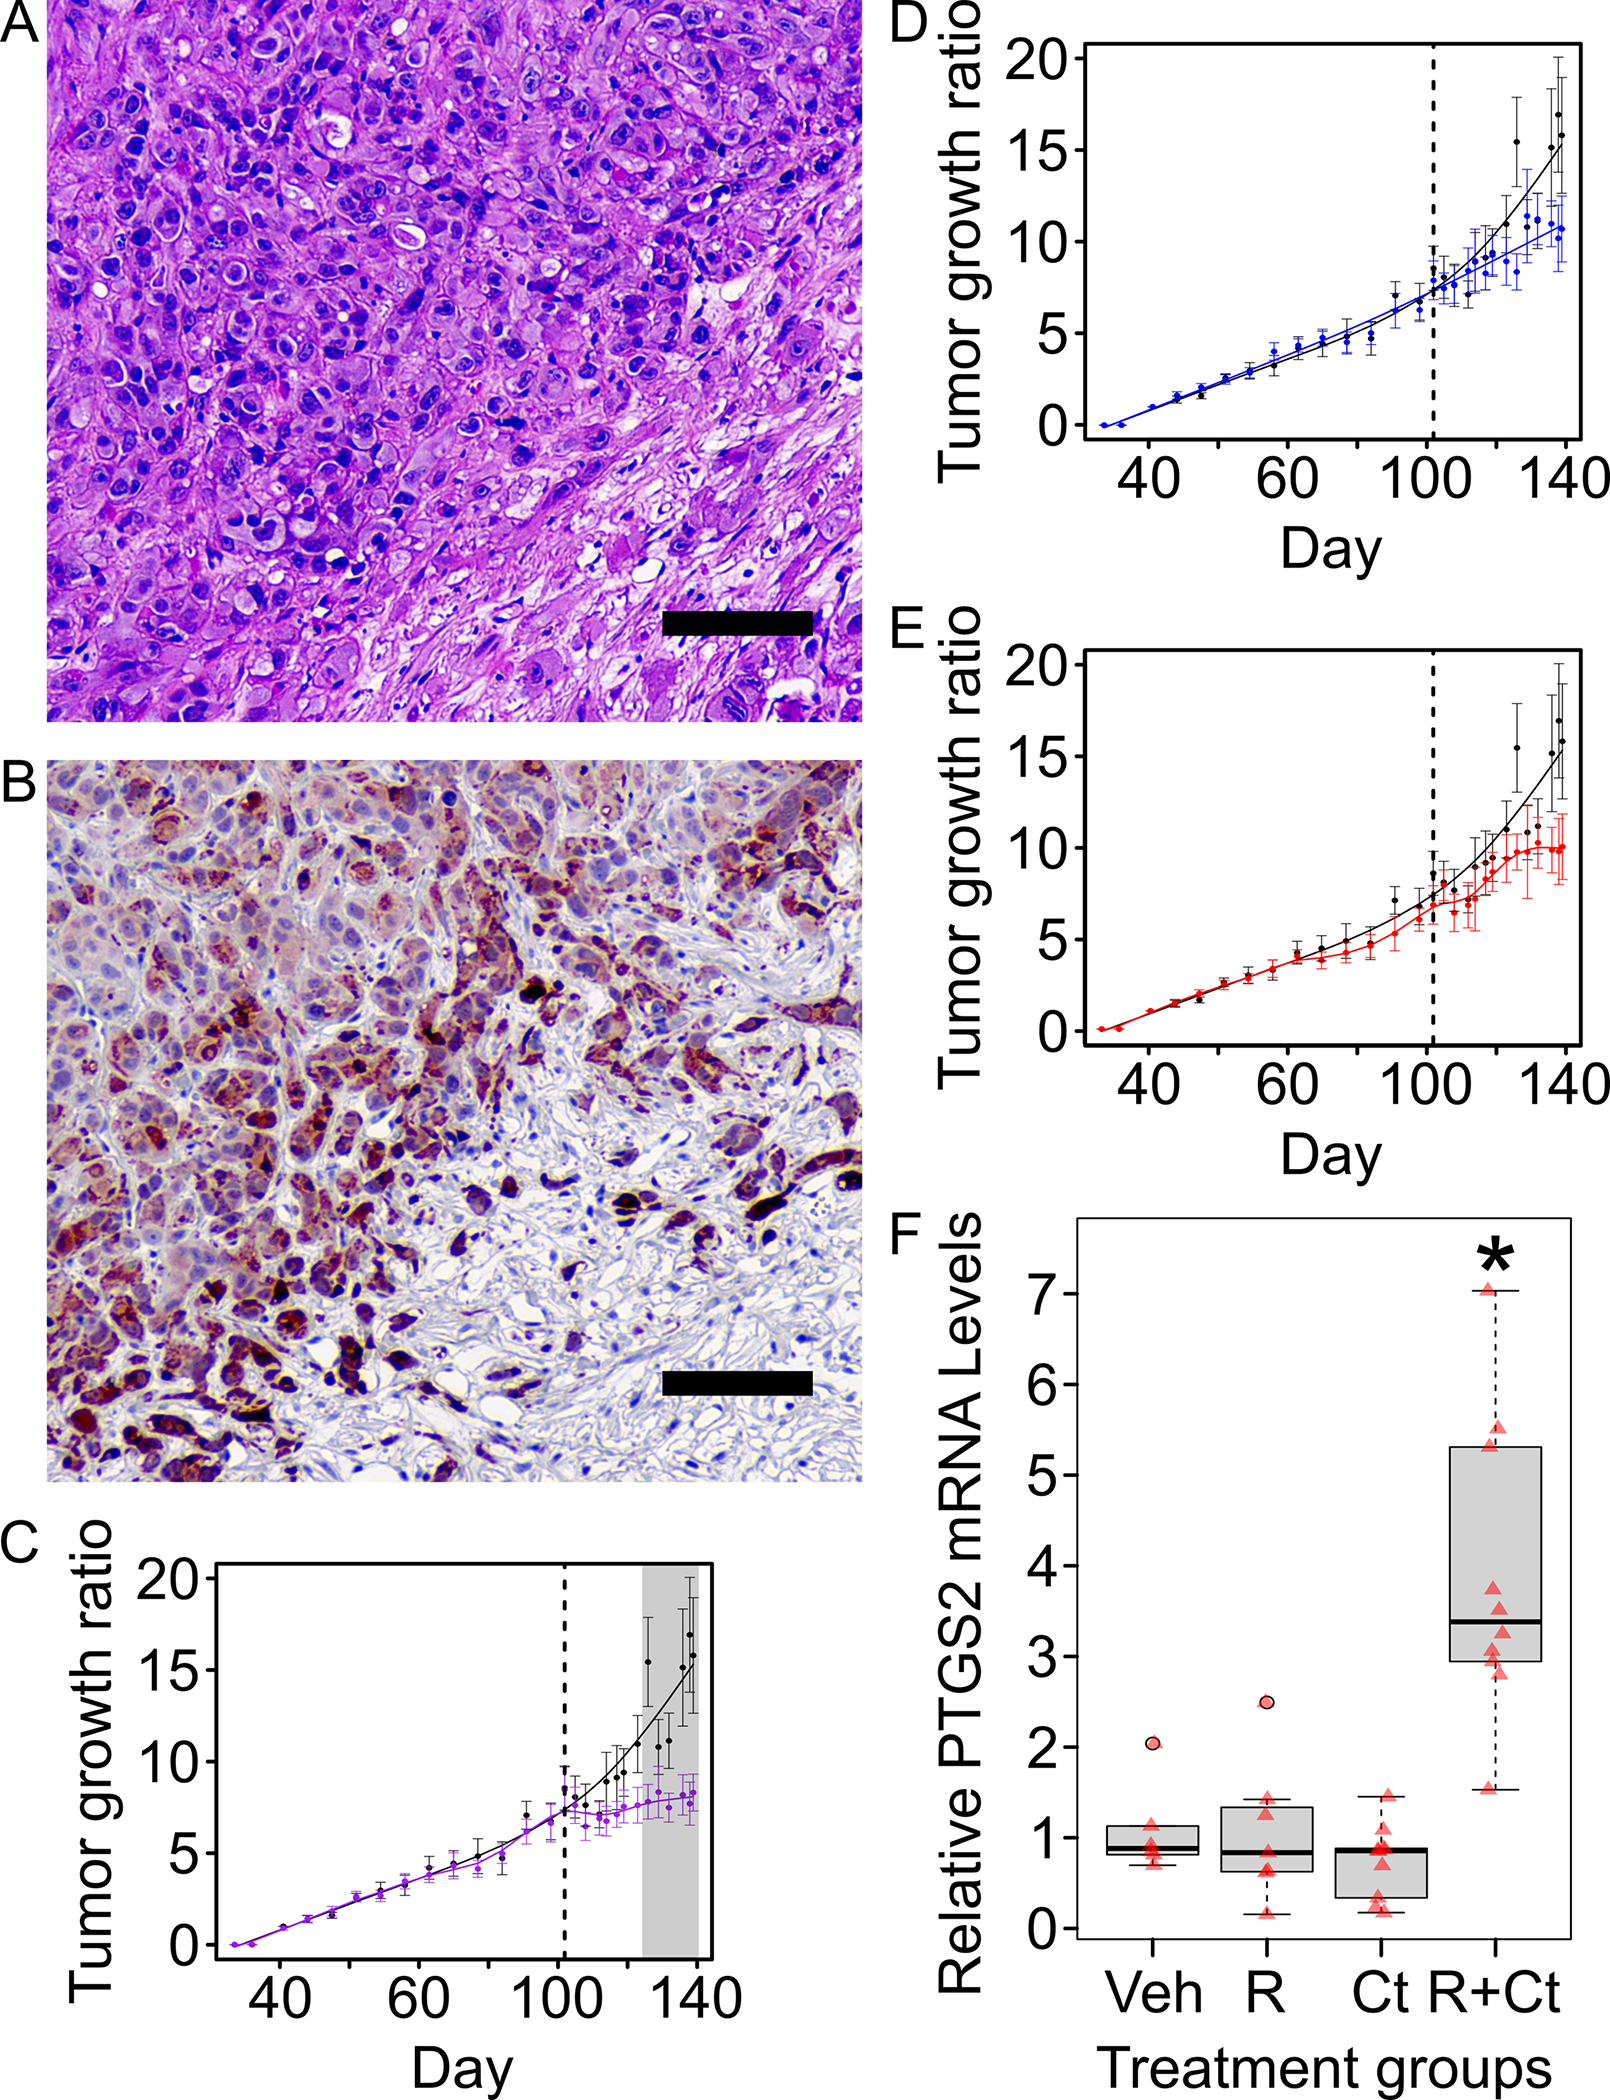
Figure 4. Xenograft model shows that HLRCC tumors are more sensitive to Cyst(e)inase-Rapamycin combination than Cyst(e)inase or Rapamycin alone.

A. Hematoxylin and Eosin (H&E) staining of a representative xenograft tumor from the control group. (scale bar = 100μm) B. Immunohistochemistry staining of the same representative xenograft tumor shown in “A” for proteins with 2-succinyl-cysteine (2-SC) modification; 2-SC is a reliable marker for FH inactivation and is a marker for HLRCC tumors. (scale bar = 100μm) C. D. & E. Xenograft mouse model studies showed that Rapamycin-Cyst(e)inase combination treatment suppresses tumor growth in vivo. Ten million NCCFH1 cells suspended in a 1:1 ratio of PBS:Matrigel were injected into the right flank of each NSG mouse (equal number of male-female mice per group). Tumors were allowed to grow to an average tumor volume of 100mm3 before proceeding with the treatments. Treatment start day is indicated with a dotted vertical line. Error bars represent standard error of mean (SEM). Statistical significance was determined using analysis of variance (ANOVA) followed by Tukey Honest Significant Difference (Tukey-HSD). Grey shaded area indicate data points where treatment group is significantly different (p-value <0.05) from control group (black line). Panels C, D, and E share the same control group. C. Rapamycin-Cyst(e)inase combination treatment group (purple line) showed growth suppression when compared to the control group (black line). D. Rapamycin alone treatment group (blue line) did not show a significant growth suppression when compared to control group (black line). E. Cyst(e)inase alone treatment group (red line) did not show a statistically significant growth suppression when compared to the control group (black line). F. Rapamycin-Cyst(e)inase combination group (R+Ct) showed significant upregulation of ferroptosis marker, PTGS2 when compared to vehicle (Veh), rapamycin (R), or Cyst(e)inase (Ct) only groups. PTGS2 mRNA levels in xenograft tumors were determined using a Taqman® gene expression qPCR assay. Taqman® probe for beta-actin was used as internal loading control. Results from the qPCR was analyzed using the delta-delta-ct method with samples in the Veh group set as 1. Red colored triangles represent relative PTGS2 mRNA from individual tumor. Asterisk indicates p-value < 0.05 as compared to Veh group. P-values were calculated using Mann-Whitney U Test.
