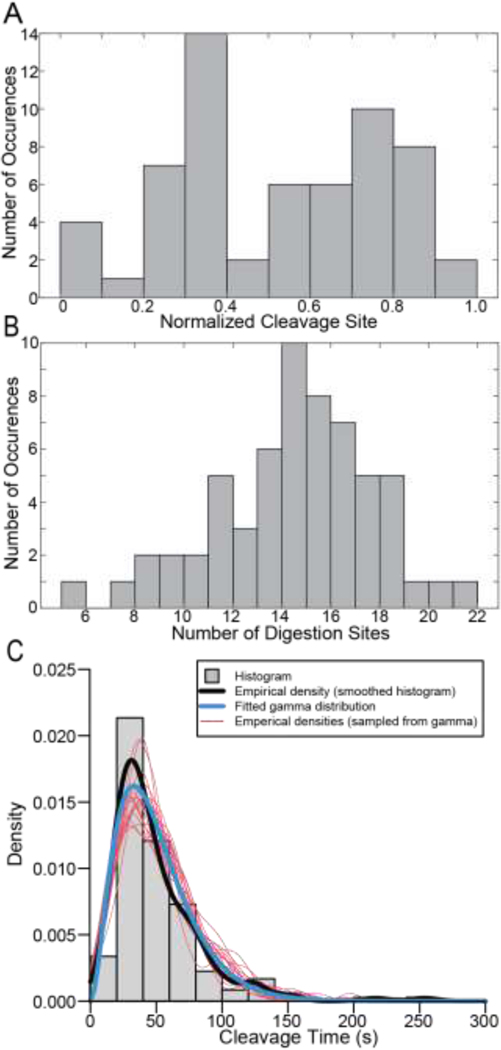
Figure 2: Location of the Cleavage Site, Number of Distinct Digestion Sites and Cleavage Times.
A) Histogram showing the normalized location of cleavage sites of fibrin fibers. B) Histogram showing the number of digestion sites on a single fibrin fiber. 60 fibers were used for these analyses. Locations were normalized as described in Supplemental Section A.6 and Supplemental Figures 6&7. C) Histogram showing the time taken for fibers to be cleaved (gray), as well as an empirical density function (black) corresponding to the continuously measured cleavage times, fitted gamma distribution (blue), and empirical density functions calculated for twenty independent samples (each of size n = 178) from the fitted gamma distribution (red).

