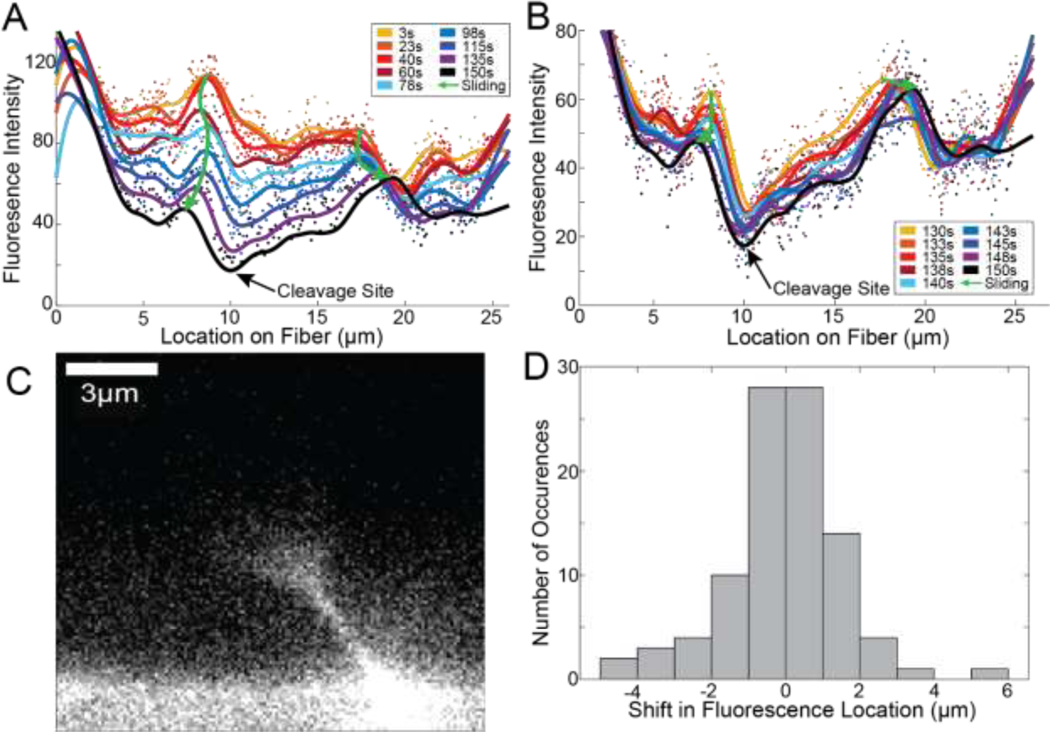
Figure 6: Structural Evolution of a Representative Fiber.
A) Plot showing traces of the average cross-sectional fluorescence intensity for a representative fiber at multiple instances in time. Peaks in the traces change locations longitudinally along the fiber, termed fluorescence sliding. Two prominent peaks are marked with green arrows but are not the only fluorescence sliding occurring. B) Plot showing a zoom-in of the data shown in panel A but looking at the average cross-sectional fluorescence intensity for the last 9 timepoints before cleavage. C) The first frame after a fiber’s cleavage shows a cone-like structure, such as the one seen in this representative image, in 52% of fibers. D) Histogram showing the displacement of 95 peaks from 45 fibers in the last 20 seconds of their digestion. A negative shift represented a leftward movement, and a positive shift represented a rightward movement.

