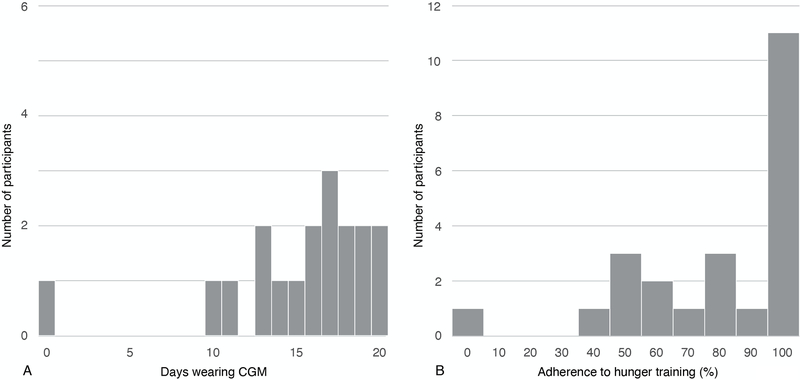
Figure 3.
Adherence to Hunger Training. A. Days wearing continuous glucose monitor (CGM) (N=24). This depicts the duration (in days) that the participants wore the CGM; and B. Adherence to logging glucose and hunger on CGM days (N=23). This shows the number of participants that adhered at different levels. The percentage adherence was calculated as the ratio of days logging pre-meal glucose and hunger levels to the total number of valid CGM days during the training period worn. N=1 participant was not included in B since she did not have any days wearing CGM.

