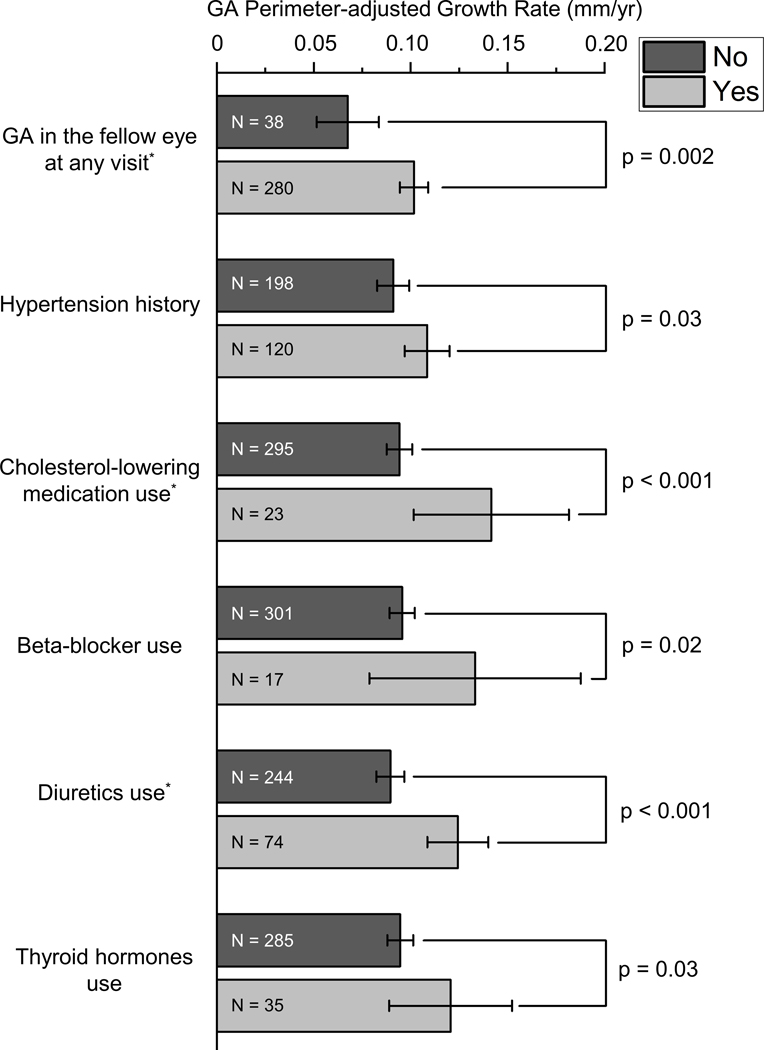
Figure 1.
Six factors were significantly associated with the perimeter-adjusted growth rate of geographic atrophy based on the univariable linear mixed-effects model (p<0.05). The number within each bar represents the number of eyes within the group. The error bar represents the 95% CI of the mean. Among the six factors, three factors (marked with *) remained statistically significant in the multivariable model. GA, geographic atrophy.

