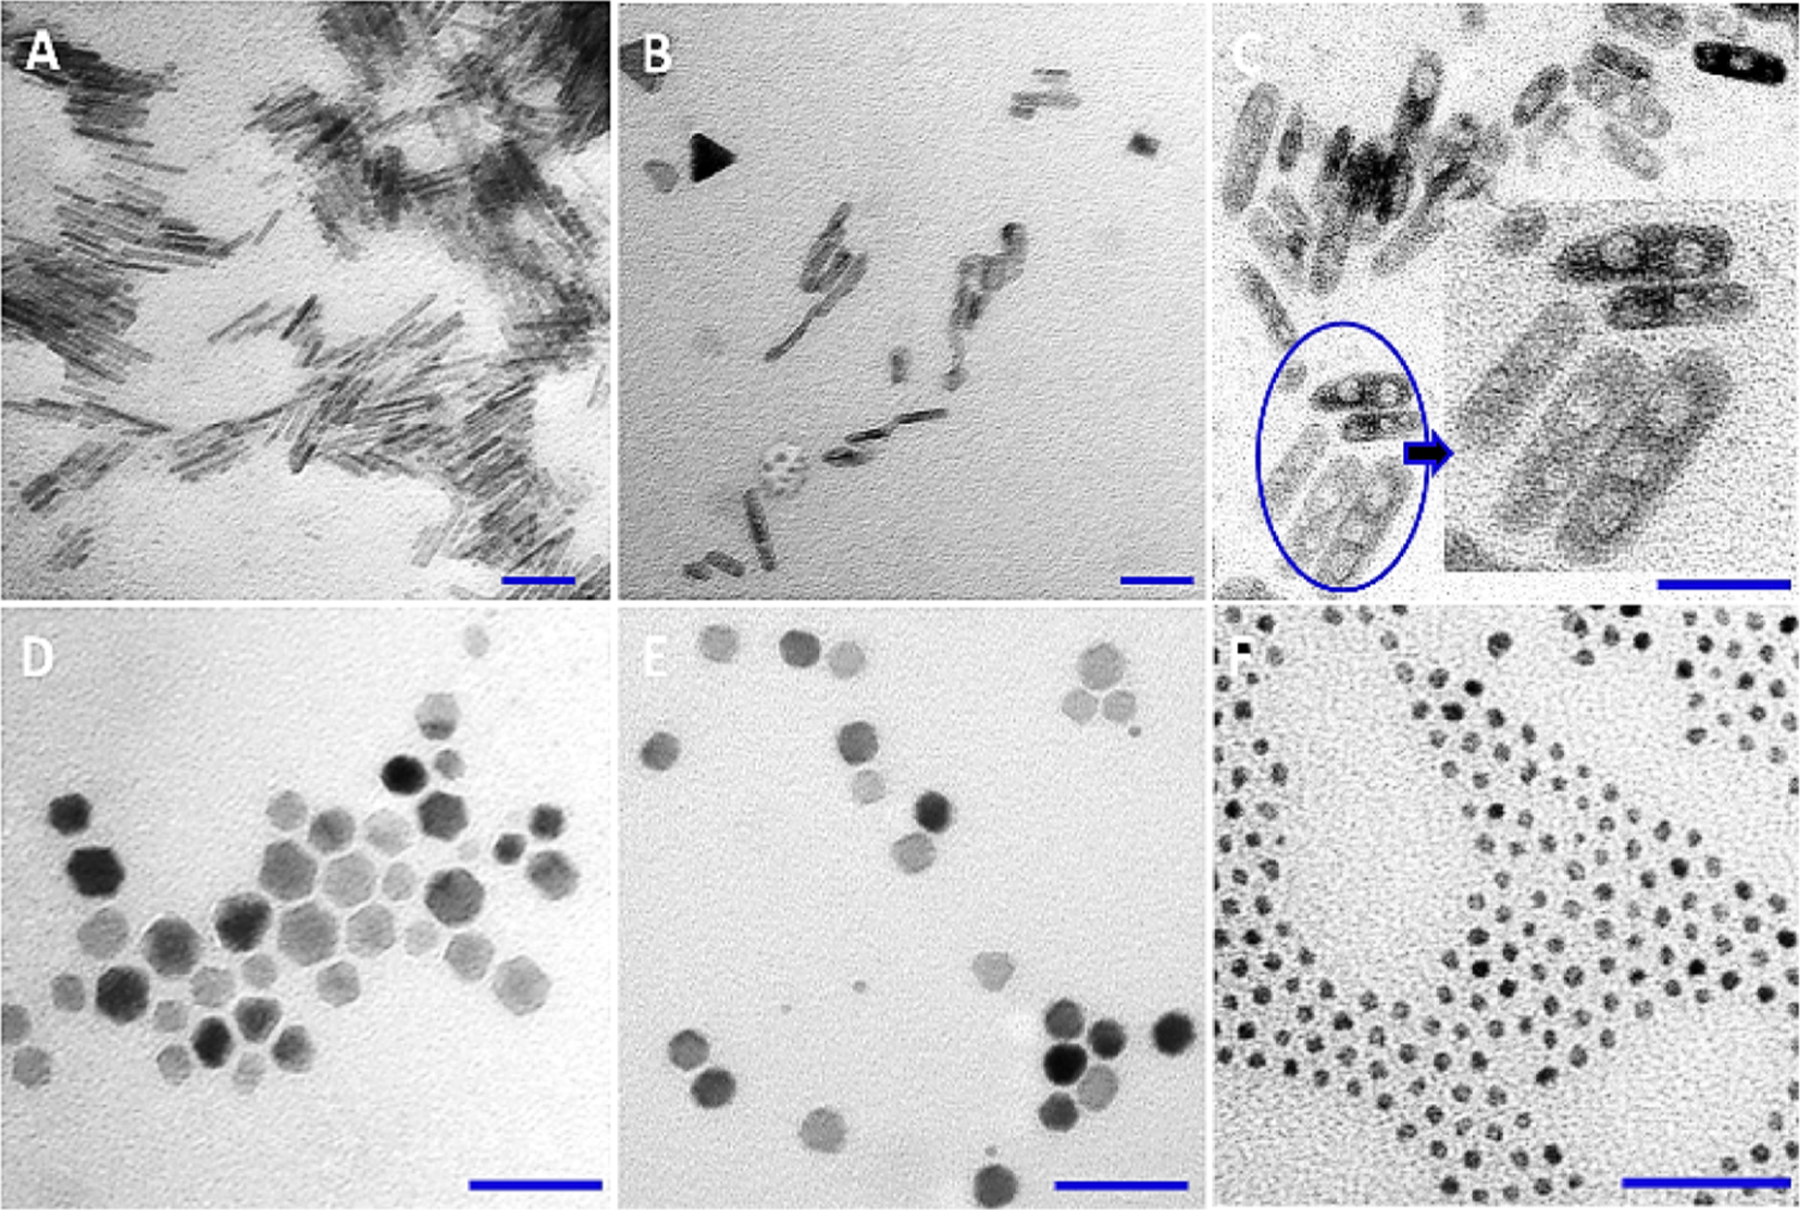
Figure 2.

TEM images of the examples of iron oxide crystals with various shapes. The shapes and morphologies of these materials were obtained by modulating: reaction temperature (A, B), reaction time (C), and oleylamine concentration (D–F). The scale bar is 50 nm.
