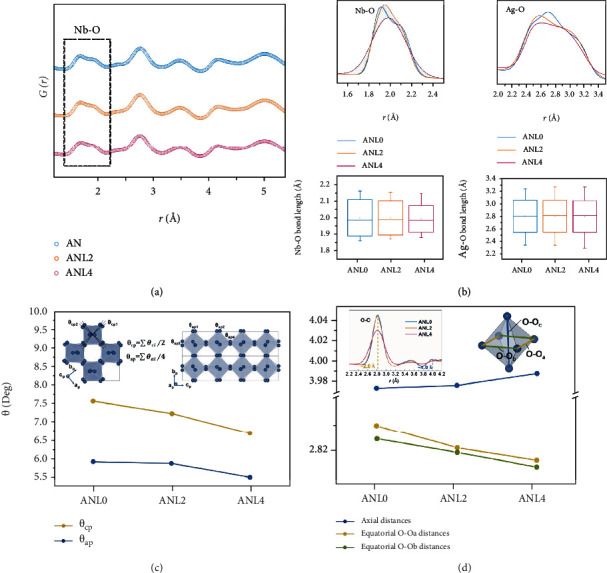
Figure 2.

Local structural characteristics of AN, ANL2, and ANL4. (a) Experimental G(r) of AN, ANL2, and ANL4 with Nb-O pairs highlighted. (b) Partial Nb-O (upper left) and Ag-O (upper right) PDFs as obtained from PDF refinements. Box plots of Nb-O (bottom left) and Ag-O (bottom right) bond length distribution. The edges of the boxes indicate the standard deviations. (c) Oxygen octahedral tilting angles as a function of composition. The insets are schematic illustrations of AgNbO3 lattice viewed along cp and ap axes with the tilting (rotation) angles highlighted. (d) Equatorial O-Oa and O-Ob distances and axial O-Oc distances as a function of composition. The inset shows the partial O-O PDFs and the [NbO6] octahedron with specific O-O distances marked.
