Figure 5.

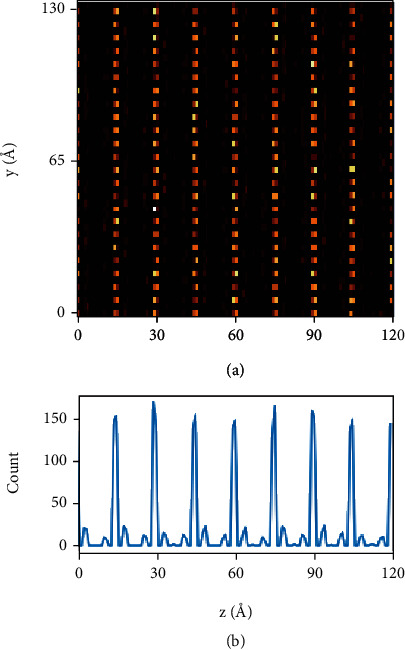
An illustration of ordered A-site vacancies in ANL4. The y and z axes correspond to the <010> and <001> directions, respectively. (a) An in-plane detailed view of vacancy positions. (b) Histogram of vacancies on different layers.

An illustration of ordered A-site vacancies in ANL4. The y and z axes correspond to the <010> and <001> directions, respectively. (a) An in-plane detailed view of vacancy positions. (b) Histogram of vacancies on different layers.