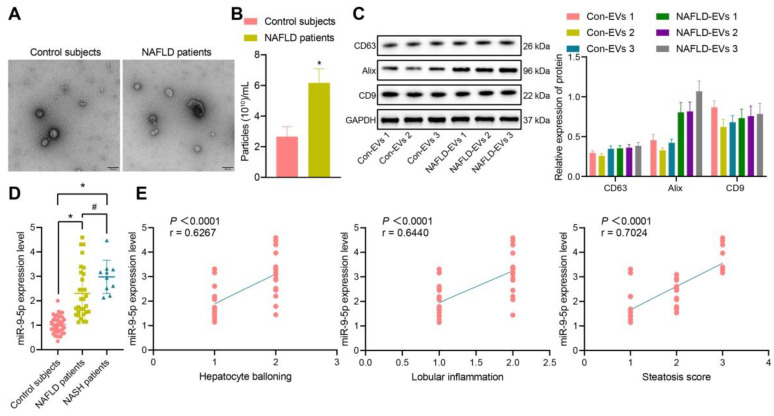
Figure 1.
miR-9-5p expression is increased in the plasma-derived EVs from NAFLD patients. A, The morphology and diameter of EVs detected by TEM; B, The diameter and number of EVs detected by NTA. C, The expression of CD63, Alix, and CD9 in the EVs determined using Western blot analysis. D, miR-9-5p expression measured in plasma-derived EVs from NAFLD patients. E, Correlation between miR-9-5p expression and liver score of NAFLD patients. N (healthy individuals) = 24, N (NAFLD) = 11, N (NASH) = 11. * p < 0.05 vs. healthy individuals, # p < 0.05 vs. patients with NASH. Data are shown as the mean ± standard deviation of three independent experiments. Unpaired t-test was used for analysis differences between two groups. Data among multiple groups were compared using one-way ANOVA with Tukey post hoc tests used. Spearman's rank order correlation analysis was used to assess the correlation between the two parameters.

