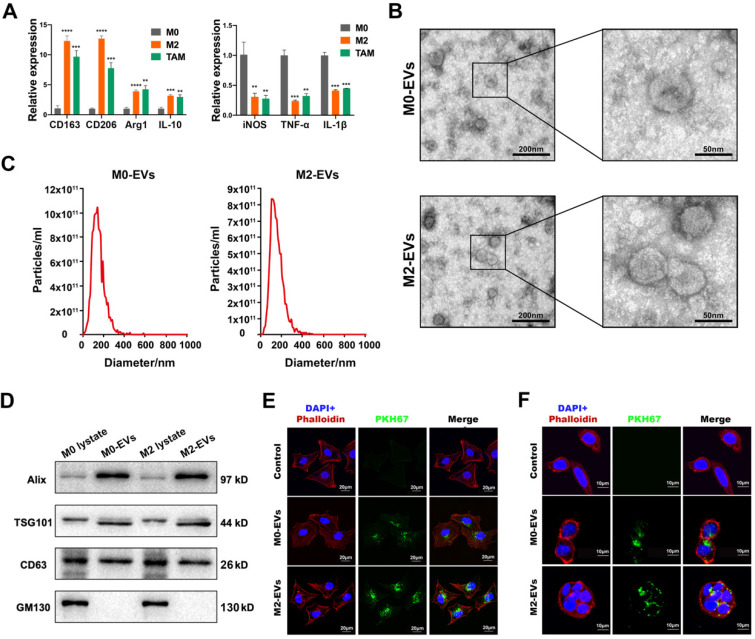
Figure 1.
Characterization of macrophages and their EVs. (A) RT-PCR was used to compare the expression level of M2 and M1 macrophage biomarkers among M0 macrophage, IL-4 and IL-13 induced M2 macrophage and SW480-condition medium stimulated macrophages (**p<0.01, ***p<0.001, ****p<0.0001, compared to M0 macrophage group). (B) Morphological images of M0 and M2 macrophage derived EVs were captured by transmission electron microscope. (left scale bar = 200nm, right scale bar = 50nm). (C) Nano-particle analysis was used to analyze the particle size distribution of M0 and M2 macrophage derived EVs. (D) Western blot assay was used to detect protein biomarkers of EVs. (E) PKH67 labeled M0 and M2 macrophage derived EVs were internalized by SW480 (scale bar = 20μm). (F) PKH67 labeled M0 and M2 macrophage derived EVs were internalized by HCT-8 (scale bar = 10μm).

