Figure 3.
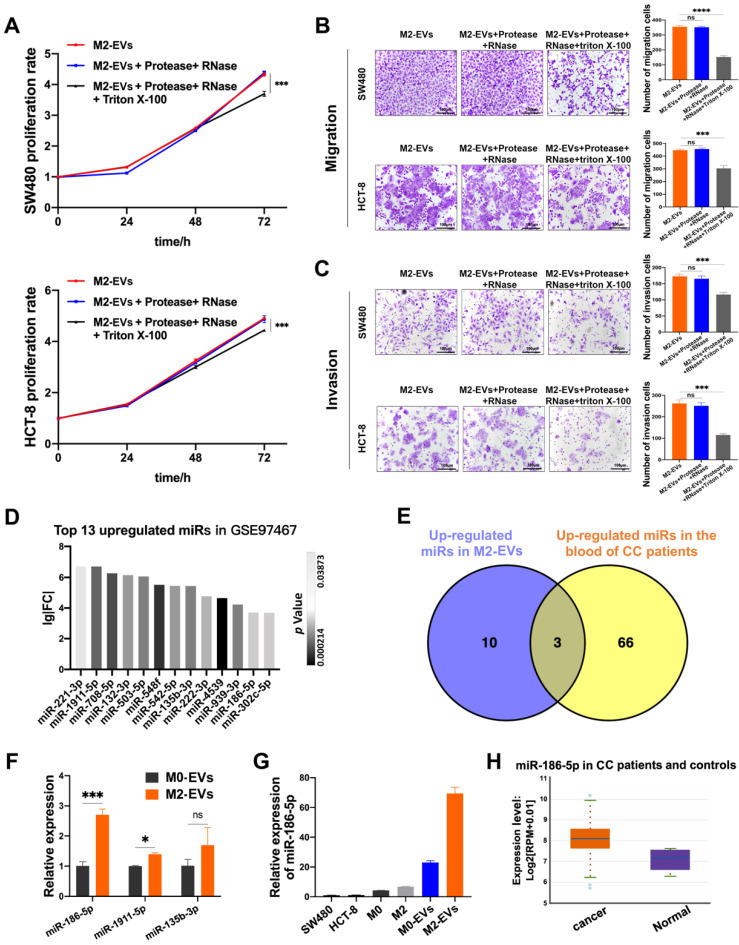
The tumor-promoting effects of M2-EVs depended on their enclosed molecules. (A) MTS assay was used to detect the proliferation of CC cells incubated in processed M2-EVs (***p<0.001). (B-C) Transwell migration and invasion assay were used to detect the motility of CC cells stimulated by processed M2-EVs (scale bar = 100μm) (***p<0.001, ****p<0.0001). (D) 13 upregulated microRNAs in GSE97467 (Geo DataSet) were illustrated in the histogram. (E) The intersection of GSE97467 and GSE61741 was presented in venn graph. (F) RT-PCR was used to determine the expression level of three candidate microRNAs in macrophages derived EVs (*p<0.05, ***p<0.001). (G) RT-PCR was used to detect the relative expression level of miR-186-5p between CC cells, macrophages and macrophage derived EVs. (H) The relative expression profiles of miR-186-5p in CC patients and healthy controls were analyzed using StarBase database, box on the left presents CC patients and the right box presents healthy controls.

