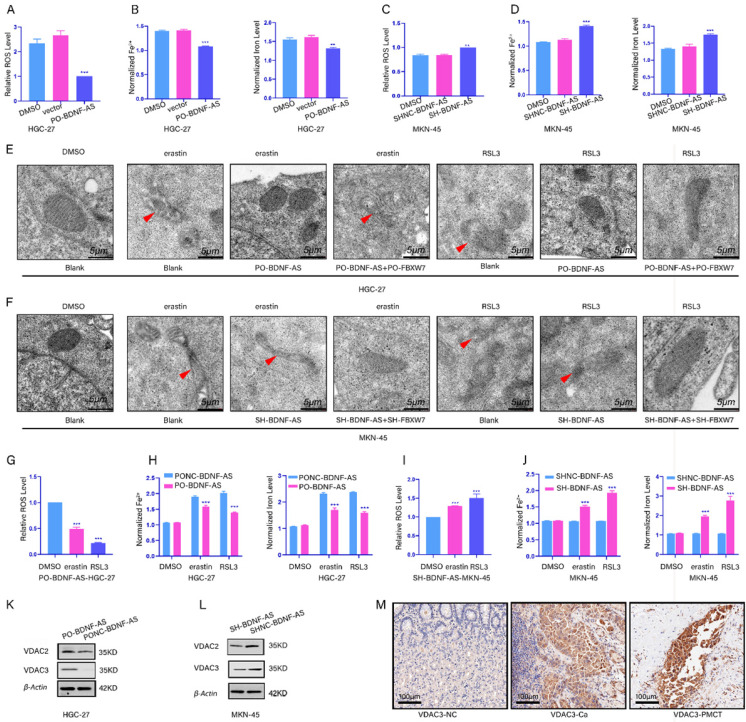
Figure 2.
BDNF-AS was associated with ferroptosis in gastric cancer cells. *p < 0.05, **p < 0.01, ***p < 0.001, ****p < 0.0001. Data are shown as mean ± SEM (n = 3). (A): The level of ROS after overexpression with BDNF-AS was detected by flow cytometry in HGC-27, DMSO served as a control. (B): The levels of Fe2+ and Iron after overexpression with BDNF-AS were detected by Iron assay kit in HGC-27 cells, DMSO served as a control. (C): The level of ROS after knockdown with BDNF-AS was detected by flow cytometry in MKN-45, DMSO served as a control. (D): The levels of Fe2+ and Iron after knockdown with BDNF-AS were detected by Iron assay kit in MKN-45, DMSO served as a control. (E): Transmission electron microscopy of HGC-27 cells treated with DMSO (24hrs), erastin (5 μM, 24hrs), RSL3 (1 μg/ml, 24hrs), PO-BDNF-AS+erastin (5 μM, 24hrs), PO-BDNF-AS+RSL3 (1 μg/ml, 24hrs). Single red arrowhead: shrunken mitochondria and mitochondrial cristae disappeared. (F): Transmission electron microscopy of MKN-45 cells treated with DMSO (24hrs), erastin (5 μM, 24hrs), RSL3 (1 μg/ml, 24hrs), SH-BDNF-AS+erastin (5 μM, 24hrs), SH-BDNF-AS+RSL3 (1 μg/ml, 24hrs). Single red arrowhead: shrunken mitochondria and mitochondrial cristae disappeared. (G): The level of ROS after overexpression with BDNF-AS and treatment with DMSO, erastin (5 μM) and RSL3 (1 μg/ml) for 24h was detected by flow cytometry in HGC-27 cells. (H): The levels of Fe2+ and Iron after overexpression with BDNF-AS and treatment with DMSO, erastin (5 μM) and RSL3(1 μg/ml) for 24h were detected by Iron assay kit in HGC-27 cells. (I): The level of ROS after knockdown with BDNF-AS and treatment with DMSO, erastin (5 μM) and RSL3 (1 μg/ml) for 24h were detected by flow cytometry in MKN-45 cells. (J): The levels of Fe2+ and Iron after interference with BDNF-AS and treatment with DMSO, erastin (5 μM) and RSL3 (1 μg/ml) for 24h were detected by Iron assay kit in MKN-45 cells. (K-L): The variations of VDAC2/VDAC3 proteins expression level of overexpression (K) or knockdown (L) BDNF-AS were determined by western blotting assay in HGC-27 and MKN-45 cells. (M): The representative IHC staining images for VDAC3 in the para-cancerous normal tissues, GC tissues and PM of GC tissues.

