Figure 6.
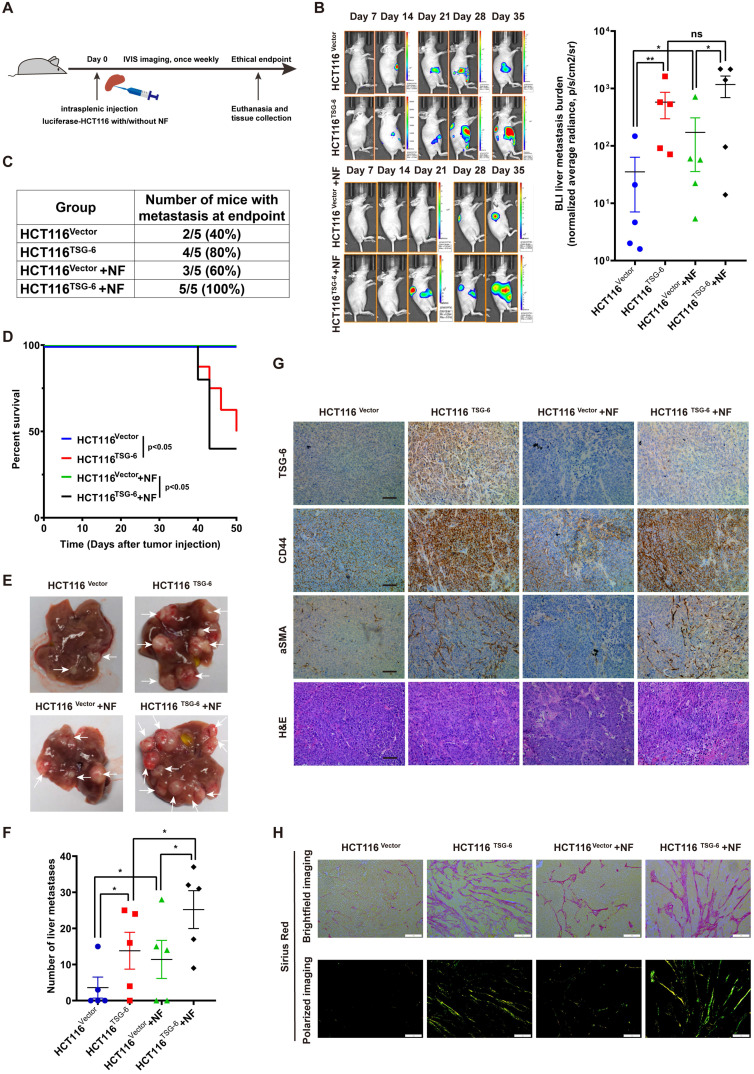
Crosstalk between TSG-6-overexpressed cancer cells and normal fibroblasts drives metastasis in vivo. (A) Schematic representation of intrasplenic injection of TSG-6-overexpressed HCT116 with or without fibroblasts and IVIS monitoring of liver metastasis. (B) Left panel: representative images of whole body IVIS imaging in mice bearing liver metastatic burden from four groups, five mice for each group (n=5). Right panel: statistical chart summarized the average bioluminescent imaging signal of all mice at the end of the experiment for each group. (C) Table summarizing liver metastatic rate for each group. (D) Kaplan-Meier analysis of survival in mice for each group. (E-F) Representative images of metastatic foci (pointed out with white arrow) in mice liver (E) and number of liver metastatic foci for mice (F) in all four groups. (G) IHC staining of TSG-6, CD44, α-SMA and H&E staining in paraffin-embedded sections from the resected mice livers. Scale bar represent 100 µm. (H) Representative images of picrosirius red staining imaged with brightfield or polarized light. Scale bar represent 100 µm. Data information: Error bars represent mean ± S.E.M. Statistical analysis was performed using two tailed unpaired Student's t-test (B, F) and Log-rank Gehan-Breslow-Wilcoxon test (D). *p<0.05, **p<0.01.

