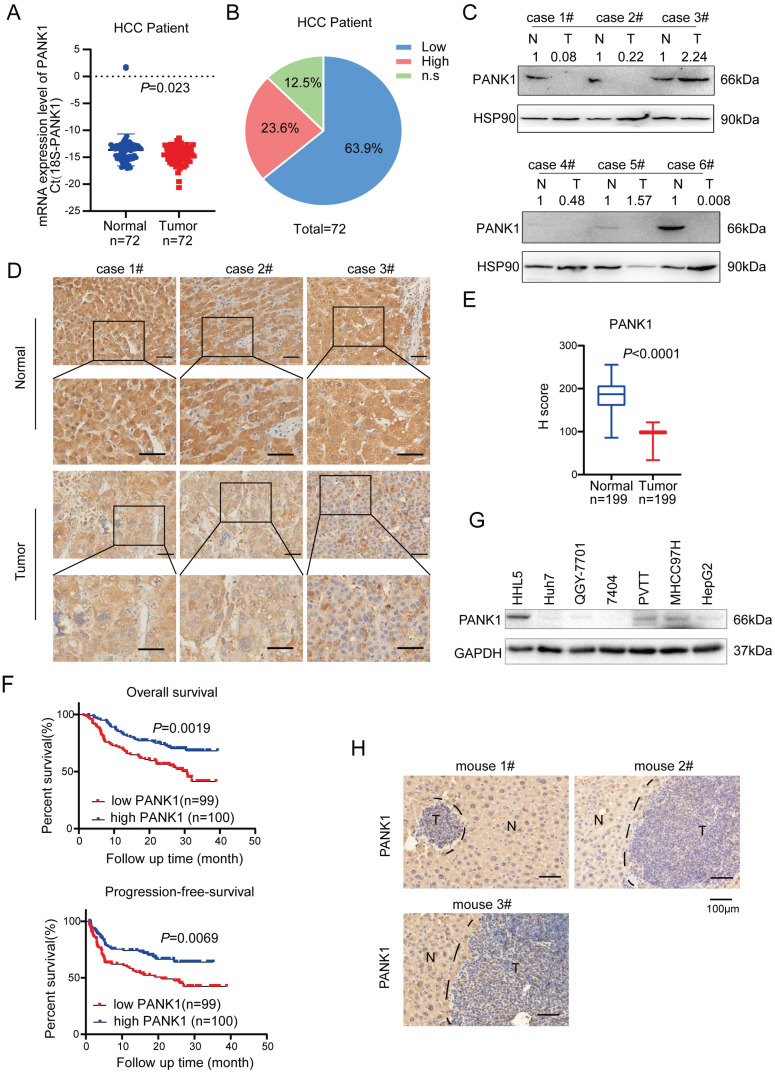
Figure 1.
PANK1 is down-regulated in HCC. (A) qPCR was used to measure the mRNA level of PANK1 in 72 cases of HCC tissues and adjacent tissues. The diagram took Ct (18S-PANK1) as the ordinate. 18S was used for internal reference. (B) This pie chart showed the changes of PANK1 mRNA in HCC tissues and adjacent tissues from the same patient. “Low”, PANK1 expression was lower in tumor tissues than in adjacent tissues; “High”, PANK1 expression was higher in tumor tissues than in adjacent tissues. N.S, no change. (C) Western blot was used to measure the level of PANK1 protein in 6 cases of HCC tissues and paired adjacent tissues. N, the adjacent tissue; T, the tumor tissue. (D) Immunohistochemistry (IHC) was used to measure the level of PANK1 protein in 3 cases of HCC tissues (tumor) and adjacent tissues (normal). (E) The level of PANK1 protein in the adjacent tissues and HCC tissues in the HCC tissue array was scored. After immunohistochemical staining, the tissue array (including 199 cases of HCC tissues and paired normal tissues) was scored. (F) Survival analysis. Analysis of the correlation between expression of PANK1 and overall survival/progression-free survival. (G) Western blot was used to measure the level of PANK1 protein in HCC cell lines (HHL5, Huh7, QGY-7701, 7404, MHCC97H, PVTT, and HepG2). (H) IHC was used to measure the level of PANK1 protein in the DEN-induced HCC model mice. N, the normal tissues; T, the tumor tissues. The scale bars were indicated.

