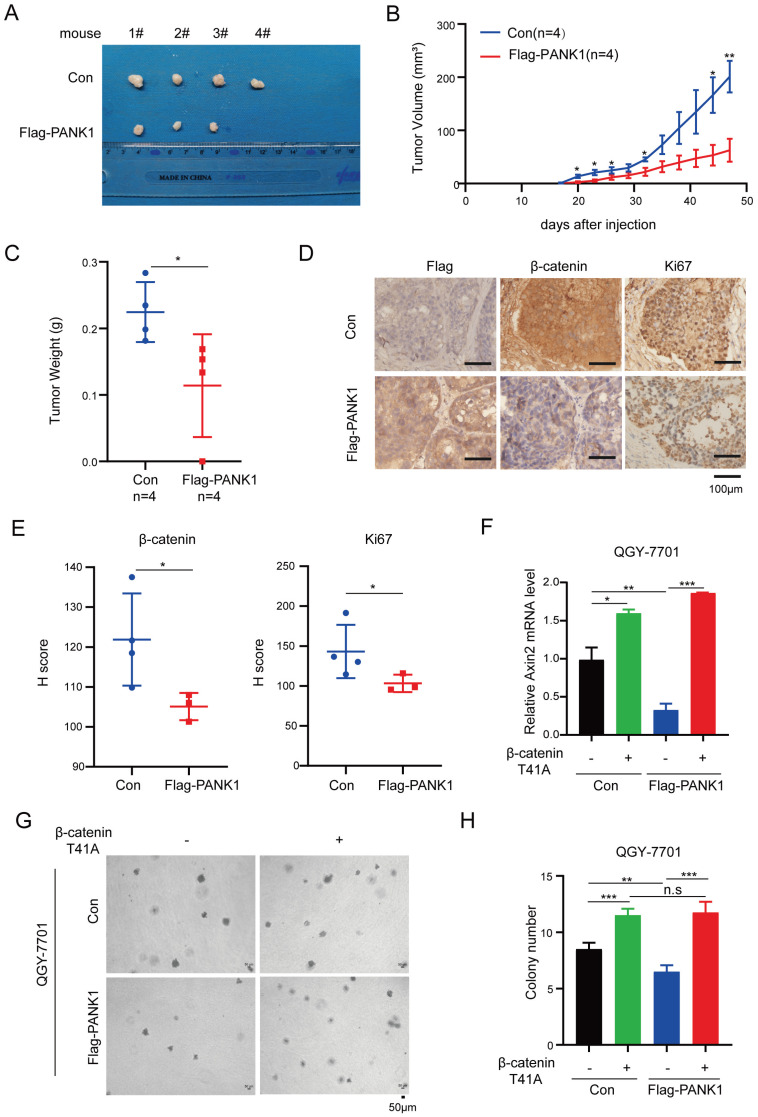
Figure 6.
PANK1 impairs the tumorigenicity of HCC cells. (A) The morphology of the xenografts formed by the Huh7 cells with the overexpression of PANK1 or the control cells. See materials and methods for details. (B) Growth curve of xenograft tumors. Tumor volumes were measured at indicate time points. (n=4, Error bars represent SEM, *P<0.05, paired t-test). (C) The weight of the xenografts was examined. * P<0.05, paired t-test. (D-E) Representative images of immunohistochemical (IHC) staining for Flag-PANK1, β-catenin and Ki67 in xenografts. Scale bar,100 µm. The H-Scores of (D) were analyzed. (F) qPCR assay was performed to measure the rescue effect of β-catenin (T41A) on the mRNA level of Axin2 in QGY-7701 cells with overexpressed PANK1. (G-H) A soft agar assay was performed to measure the rescue effect of β-catenin (T41A) on colony formation of QGY-7701 cells with overexpressed PANK1. Colonies were counted and the analyzed. The scale bars were indicated. *, P<0.05; **, P<0.01; ***, P<0.001.

