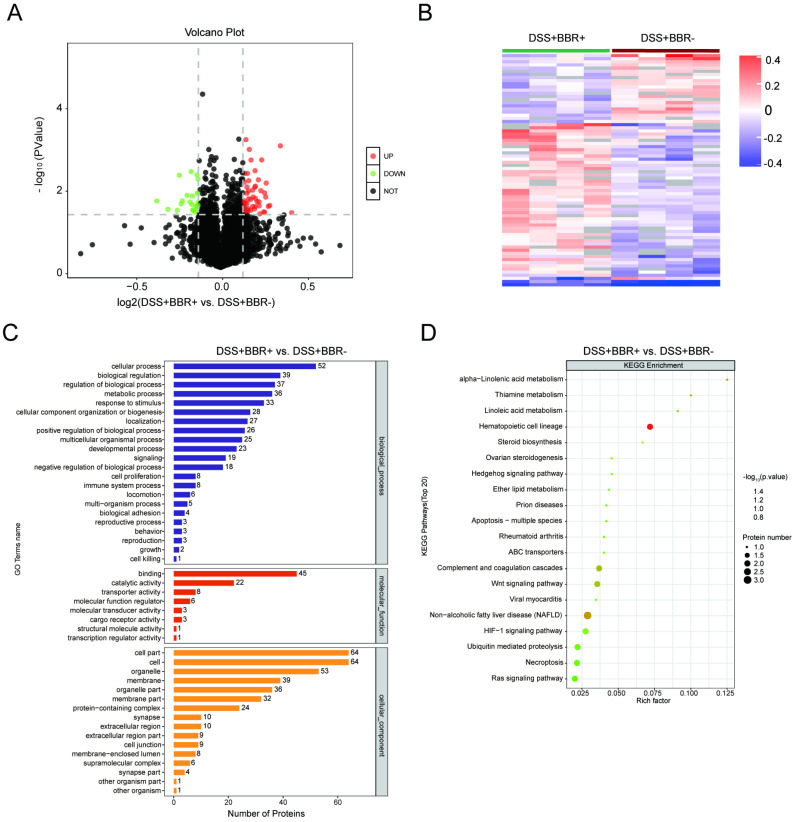
Figure 6.
BBR treatment significantlyalter the proteomics of colon tissue. Volcano graph of the distribution of the different proteomics in DSS+BBR+ and DSS+BBR- groups, the red dots represents up-regulated proteins and green dots represent down-regulated proteins. (B) Hierarchical clustering of proteins in DSS+BBR+ and DSS+BBR- groups. (C) GO biological process analysis in DSS+BBR+ and DSS+BBR- groups. (D) KEGG pathways analysis in DSS+BBR+ and DSS+BBR- groups.

