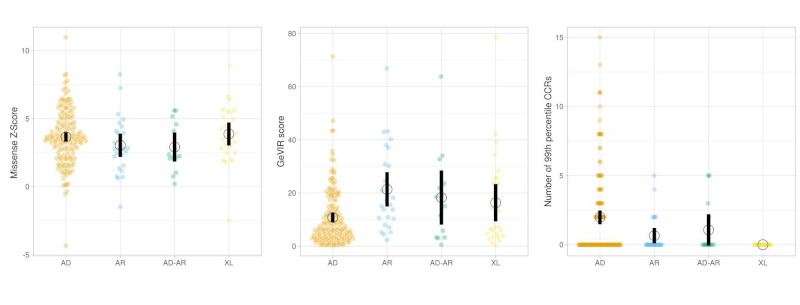
Figure 1.

Dot plot distributions of missense Z-scores, GeVIR, number of CCRs in 99th percentile for highly constrained genes (those with a probability of loss-of-function intolerance of 1) for different Mendelian modes of inheritance. Figure prepared with https://huygens.science.uva.nl/PlotsOfData/.
