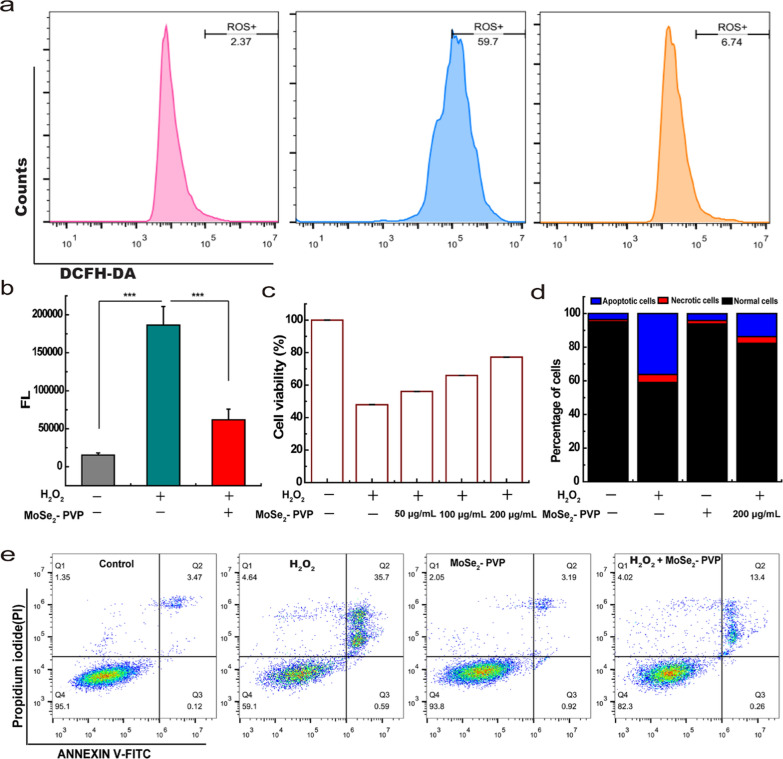
Fig. 7.
Cytoprotection effect of MoSe2-PVP NPs in vitro. a Quantitative analysis of ROS levels in RAW264.7 cells (left: healthy cells; middle: H2O2-treated RAW264.7 cells; right: H2O2/MoSe2-PVP NPs-treated 264.7 cells). b Quantitative analysis of ROS levels in RAW264.7 cells. c Viability of RAW264.7 cells after treatment with 500 µM H2O2 and different concentrations of MoSe2-PVP NPs (H2O2 -: without the H2O2; H2O2 + : with the H2O2. MoS2-PVP -: without the MoS2-PVP). A histogram diagram (d) and a scatter diagram (e) of cell apoptosis and necrosis distribution in untreated and MoSe2-PVP NPs-treated RAW264.7 cells. Representative graphics are shown, n = 3 independent experiments

