Fig. 3.
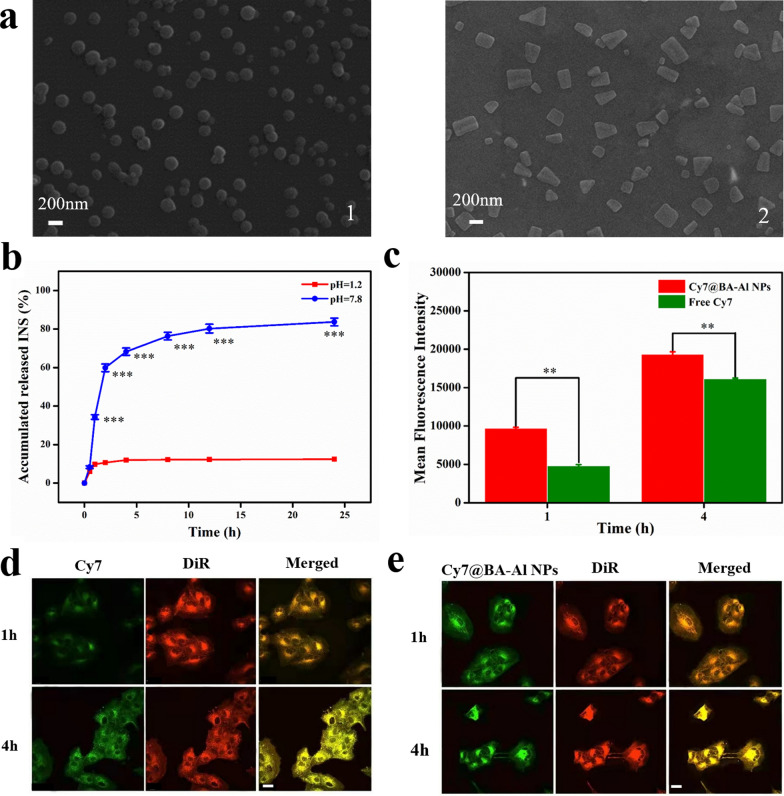
SEM images of INS@BA-Al NPs at (1) acidic condition (pH = 1.2) and (2) alkaline condition (pH = 7.8) (a); In vitro INS release of INS@BA-Al NPs at different pH conditions (n = 3, error bars = SD) *** = p < 0.001 (b); Flow cytometric analysis and quantitative results of the cells treated with free-form Cy7 and Cy7@BA-Al NPs at 1 h and 4 h, (n = 3, error bars = SD), ** = p < 0.01 (c); Confocal laser scanning microscopy images of MDCK cells after incubation with free-form Cy7, DiR for 1 h and 4 h. The scale bar = 50 μm. Green and red signals correspond to Cy7 and DiR, respectively (d); Confocal laser scanning microscopy images of MDCK cells after incubation with Cy7@BA-Al NPs, DiR for 1 h and 4 h. The scale bar = 50 μm (e)

