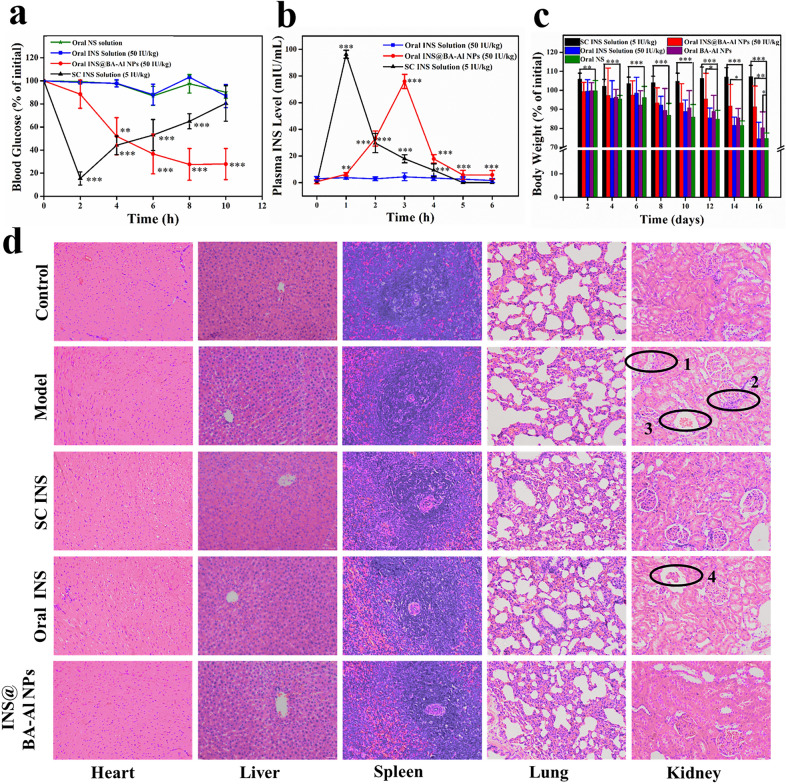
Fig. 6.
Hypoglycemic effect after oral administration in rats of normal saline (NS), free-form INS, INS@BA-Al NPs and SC administration of INS solution (n = 5, error bars = SD) (a); Plasma INS level versus time profiles of diabetic rats treated with oral administration of free-form INS solution, INS@BA-Al NPs and SC administration of INS solution (n = 5, error bars = SD) (b); Changes in body weight for 16 days (n = 3, error bars = SD). * = p < 0.05, ** = p < 0.01, *** = p < 0.001 (c); The photomicrographs of major organs (H&E staining, magnification 200 ×) of normal group, model group, diabetic rats treated with INS@BA-Al NPs group and free-form INS group, SC INS group for 16 days. The scale bar = 50 μm (d)

