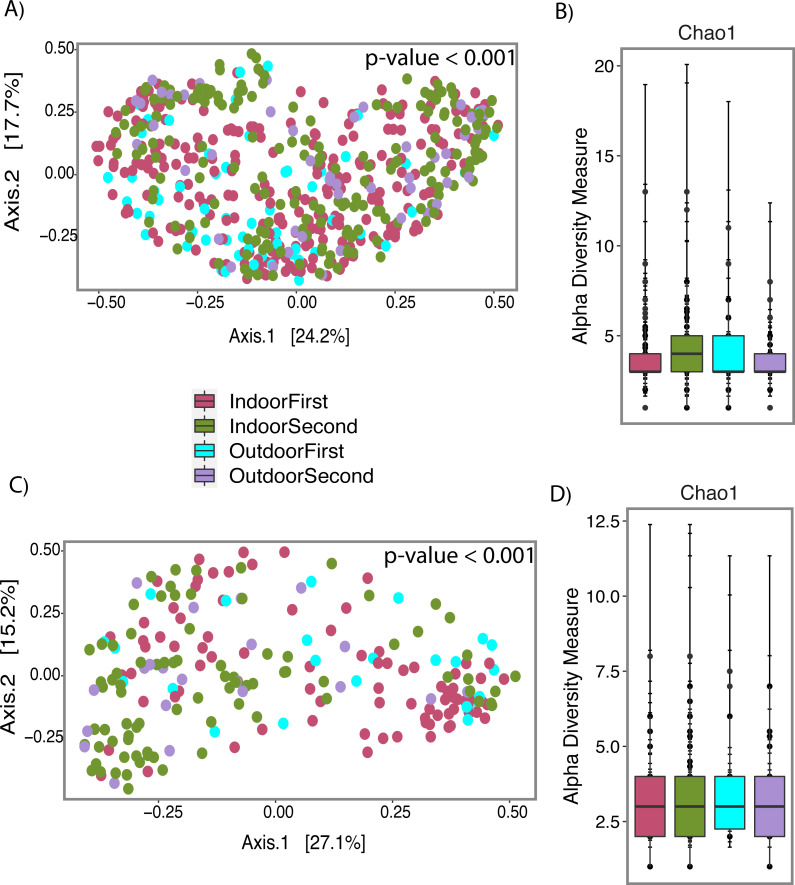
Figure 7. Fungal profile of wet (Water-Damage and Flooded homes combined) and dry homes during both sampling periods (First and Second).
(A) Alpha-diversity analysis for wet homes. (B) Alpha-diversity analysis for wet homes. (C) Beta-diversity analysis for dry homes. (D) Alpha-diversity analysis for dry homes. (A, B, C, D) Pink, Green, Light Blue and Purple colors corresponds to indoor samples from first sampling, indoor samples from second sampling, outdoor samples for first sampling, and outdoor samples from second sampling; respectively. (A, C) Principal coordinate analysis (PCoA) performed with Jensen Shannon Divergence. (B, D) Chao 1 richness estimate.

