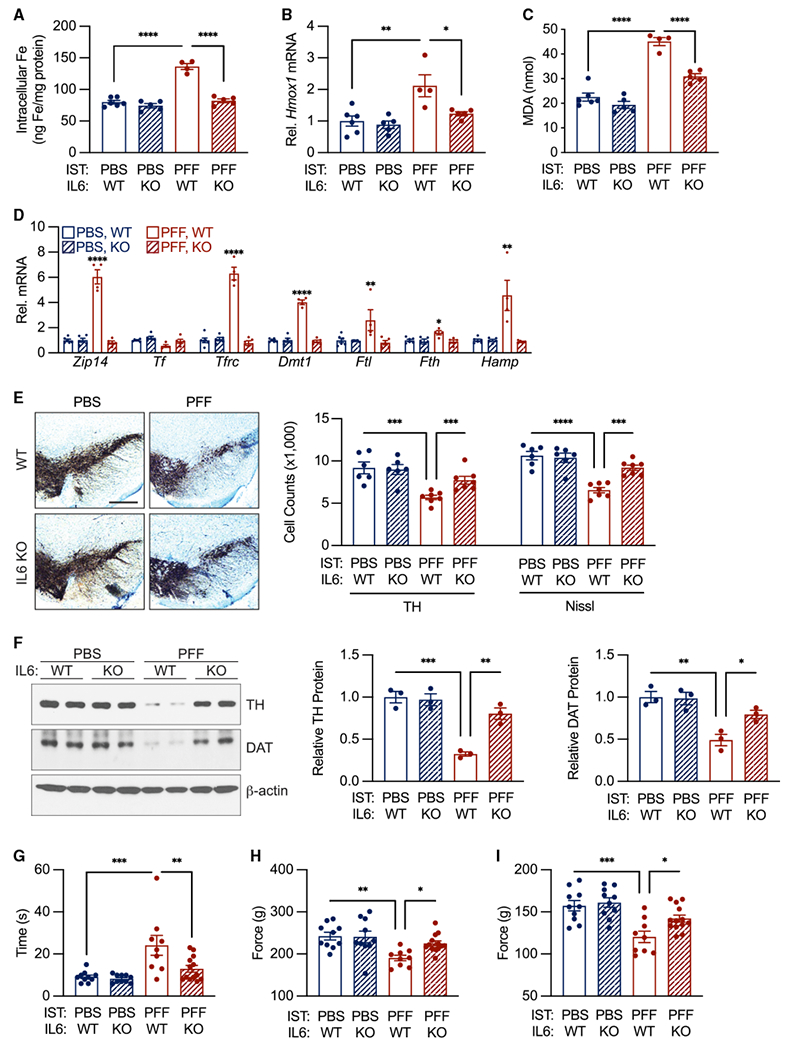
Figure 2. Interleukin-6 is necessary for α-syn-PFF-mediated neuronal CISR and behavioral deficits.

(A) α-syn PFF induced IL-6-dependent neuronal iron accumulation. Iron accumulation measured in sorted neurons (see Figure S1 for sorting paradigm) by iCP-MS. n = 4–6 biological replicates per group.
(B) α-syn PFF induced IL-6-dependent Hmox1 mRNA upregulation in neurons measured by qPCR. n = 4–6 biological replicates per group.
(C) α-syn PFF induced IL-6-dependent increase in neuronal MDA measured by ELISA. n = 4–6 biological replicates per group.
(D) α-syn PFF induced IL-6-dependent CISR mRNA elevation in neurons. Gene expression determined using qPCR. n = 4–6 biological replicates per group.
(E) α-syn PFF induced IL-6-dependent TH- and Nissl-positive neuronal loss. n = 4–6 biological replicates per group. Scale bar, 400 μm.
(F) α-syn PFF induced IL-6-dependent decrease in neuronal TH and DAT protein levels by western analysis. n = 3 biological replicates per group.
(G) α-syn PFF induced IL-6-dependent deficit in pole test performance. n = 9–13 biological replicates per group.
(H–I) α-syn PFF induced IL-6-dependent deficit in grip strength. Total grip strength shown in (H). Forelimb strength only shown in (I). n = 9–13 biological replicates per group.
Data indicate mean ± SEM. */#p < 0.05, **/##p < 0.01, ***/###p < 0.001, ****/####p < 0.0001, by two-way ANOVA (A–I) with Tukey’s HSD post hoc test.
