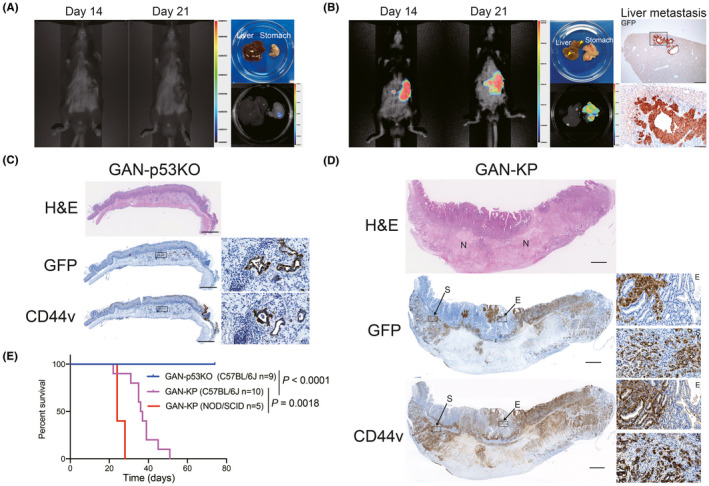
FIGURE 2.

GAN‐KP cells form invasive and metastatic gastric tumors. A, B, In vivo bioluminescence imaging of C57BL/6J mice at 14 and 21 d after orthotopic injection of GAN‐p53KO (A) or GAN‐KP (B) organoid‐derived cells (1 × 10⁵ per site) into the gastric wall (left). The macroscopic appearance and ex vivo bioluminescence imaging of the primary lesion and the liver at 21 d after cell injection are also shown (right in [A], center in [B]). The color scale and associated numbers indicate luminescence intensity level. Arrowheads indicate metastatic nodules in the liver (B). Immunohistochemical staining for GFP in liver metastatic tissue is also shown on the right in (B). The boxed region in the upper panel (scale bar, 500 µm) is shown at higher magnification in the lower panel (scale bar, 100 µm). C, D, Histology and immunohistochemical staining for GFP and CD44v in the stomach of syngeneic mice subjected to orthotopic transplantation of GAN‐p53KO (C) or GAN‐KP (D) cells (1 × 10⁵ cells per site). Scale bars, 1 mm. The boxed regions are shown at higher magnification in the insets. Scale bars, 50 µm. E, epithelium; N, necrotic region; S, submucosa. E, Kaplan‐Meier curves of overall survival for syngeneic C57BL/6J mice subjected to orthotopic transplantation of GAN‐p53KO (n = 9) or GAN‐KP (n = 10) cells or for NOD/SCID mice subjected to orthotopic transplantation of GAN‐KP cells (n = 5). The P‐values were determined with the log‐rank (Mantel‐Cox) test
