FIGURE 1.

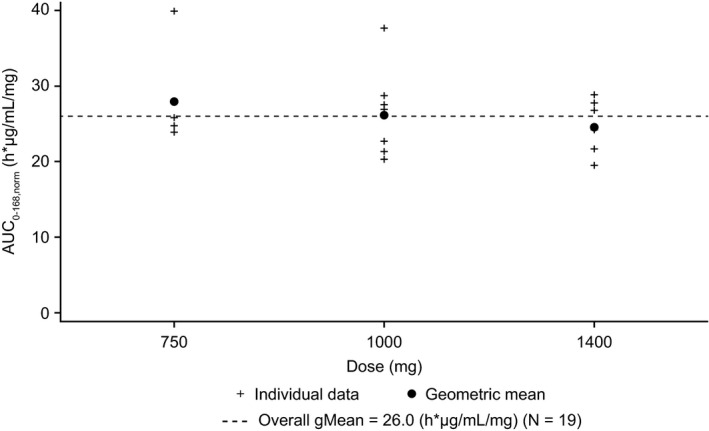
Comparison of individual and geometric mean AUC0‐168,norm values for xentuzumab after weekly intravenous infusions (n = 4/9/6). AUC0‐168,norm, dose normalized area under the curve from time 0 to 168 h post‐dose; gMean, geometric mean

Comparison of individual and geometric mean AUC0‐168,norm values for xentuzumab after weekly intravenous infusions (n = 4/9/6). AUC0‐168,norm, dose normalized area under the curve from time 0 to 168 h post‐dose; gMean, geometric mean