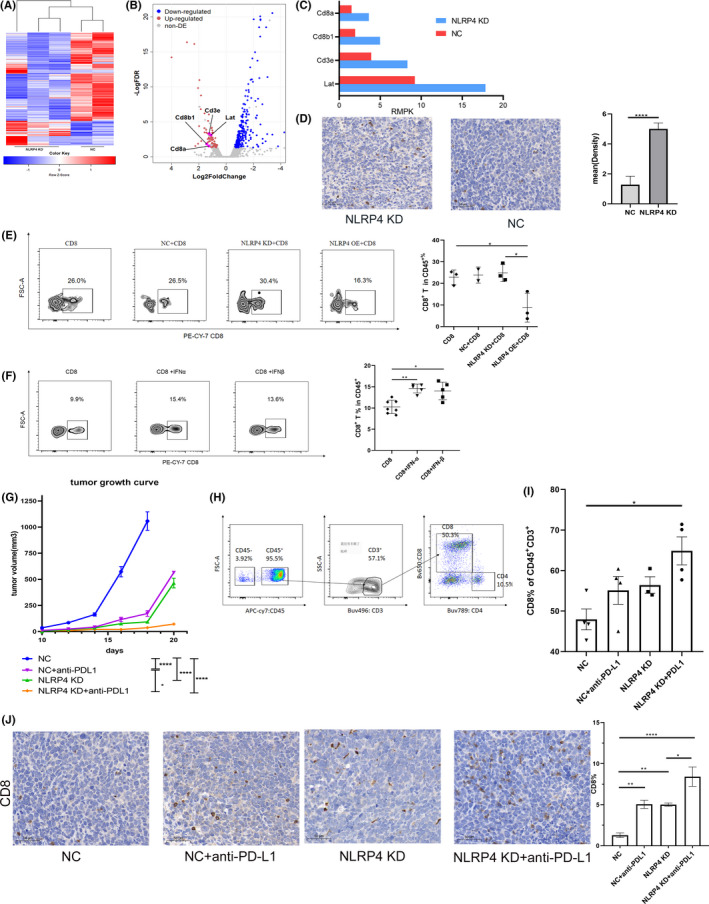
FIGURE 3.

Knockdown (KD) of NLRP4 leads to high infiltration of CD8+ T cells and orchestrates anti‐programmed cell death‐ligand 1 (PD‐L1) treatment. A, Heatmap and hierarchical clustering analysis of NLRP4‐KD and negative control (NC) Lewis lung cancer (LLC) cell tumors in mice. B, Volcano plots showing upregulated genes (red) and downregulated genes (blue) in NLRP4 KD‐LLC‐derived grafted tumors. C, Comparisons of gene expression levels (reads per kilobase per million map reads [RMPK]) related to CD8+ T cell activation based on RNA sequencing data. D, Representative images of CD8 expression in paraffin‐embedded tumors samples (left) (magnification, ×200) and statistical results (right). E, F, Percentages of CD8+ T cells (in CD45+ cells) migrating to the bottom chambers in the Transwell assays when incubating with LLC cells (E) or with the addition of interferon (IFN)‐α (200 unit/mL) or IFN‐β (200 unit/mL) (F). G, Growth curves of inoculated tumors with NC‐LLC and NLRP4 KD‐LLC cells with anti‐PD‐L1 treatment. H, CD8+ T cells gating of flowcytometric analysis. I, Flow cytometry analysis of CD8+ T cells in inoculated tumors among NC‐LLC and NLRP4 KD‐LLC cell‐derived tumors with or without anti‐PD‐L1 treatment. J, Comparison of CD8+ T cell percentages among four groups. Results are representative of two independent experiments. P values were calculated using Student’s t test. *P < .05; **P < .01; ****P < .0001
