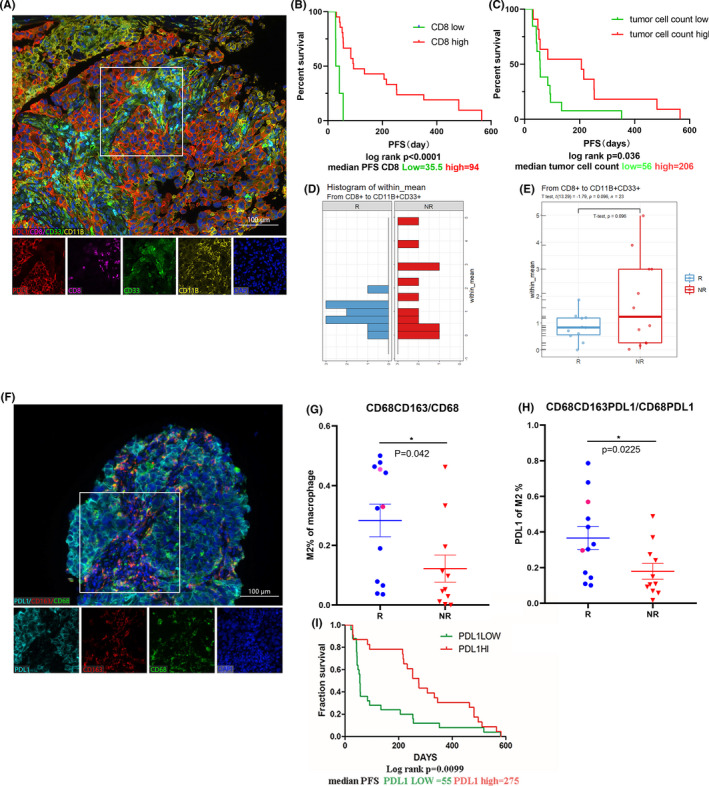
FIGURE 5.

Infiltrating lymphocyte features in the tumor microenvironment of patients with advanced non‐small‐cell lung cancer (NSCLC) before receiving anti‐programmed cell death protein 1 (PD‐1)/PD‐ligand 1 (PD‐L1) treatment. A, Representative images of multiplex immunofluorescence assays (IFAs) with CD8 (pink), CD11B (yellow), PD‐L1 (red), and CD33 (green). DAPI dye (purple) was used to indicate the nuclei. Magnification, ×200; scale bar, 100 μm. B, C, Kaplan‐Meier curves for NSCLC patients (n = 24) with (B) CD8+ T cell percentages and (C) tumor cells around CD8+ T cells. D, E, Euclidean distance of CD8+ T cells and CD33+CD11b+ myeloid cells (D), and comparison between responder (R; n = 12) and nonresponder (NR; n = 12) groups (E). F, Multiplex IFA staining of CD68 (green), CD163 (red), and PD‐L1 (blue). G, H, Percentages of CD68+CD163+ macrophages in CD68+ macrophages (G) and PD‐L1 expression in CD68+CD163+ macrophages (H) between R and NR NSCLC patients. Plots with red circles were two patients with NLRP4 mutations. I, Kaplan‐Meier curves for NSCLC patients (n = 14) with the percentages of PD‐L1 expression plotted. P values were calculated using the Mann‐Whitney U test. Kaplan‐Meier curves were plotted according to the cut‐off values determined by maximum Youden index of the receiver operating characteristic curve. *P < .05. PFS, progression‐free survival
