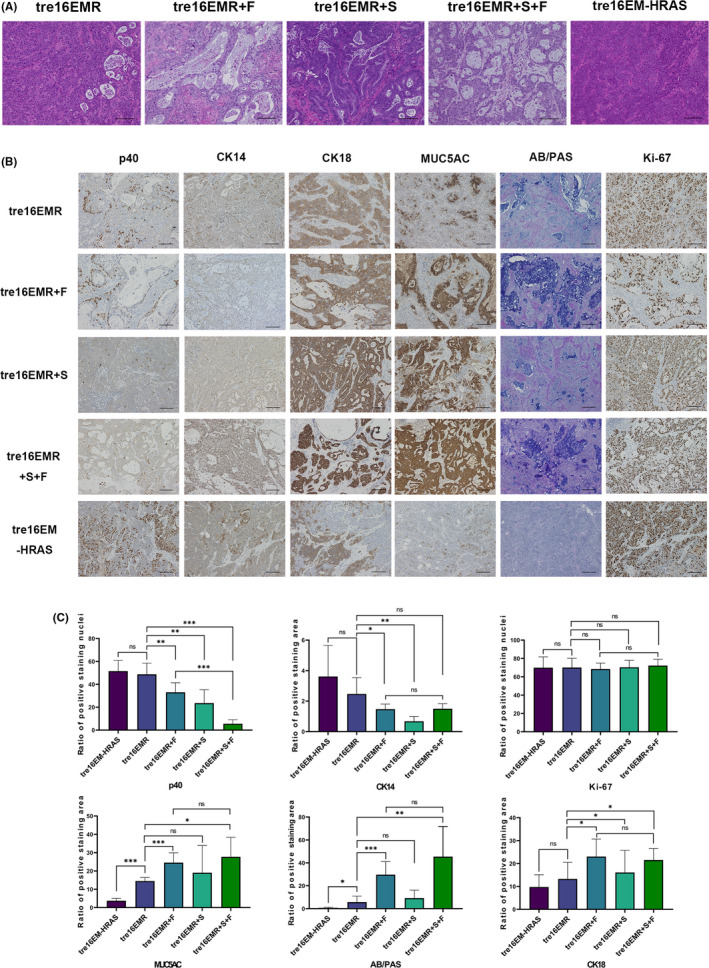
FIGURE 4.

Histopathology of tumors formed in mouse xenografts. A, B, Representative microscopic images of H&E staining (A) or Alcian blue/periodic acid‐Schiff (AB/PAS) staining and immunohistochemistry (IHC) with indicated Abs (B) for the tumors in mouse xenografts generated with HCK1T‐tre16EMR, HCK1T‐tre16EMR expressing FOXA2 (+F) and/or SMAD4mi (+S), and HCK1T‐tre16EM expressing HRASG12V (HRAS). Scale bar, 100 µm. C, Quantification of the expression of lineage‐specific markers detected using IHC in tumors with indicated cells (n > 3). Mean values from at least three independent tumors were plotted. Error bars indicate ± SD. P values were evaluated using Student’s t test. *P ≤ .05, **P ≤ .01, ***P ≤ .001. ns, not significant (P > .05)
