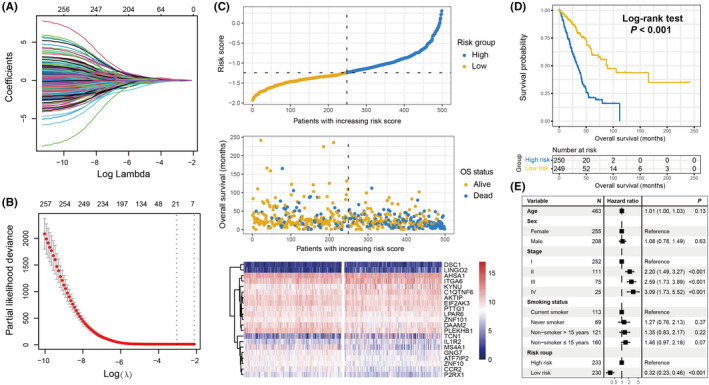
FIGURE 1.

Development of the aging risk signature and its prognostic ability. A, Lasso coefficient profiles of the 256 prognostic aging genes in TCGA discovery cohort. B, Partial likelihood deviance of distinct variable combinations demonstrated by the Lasso‐Cox model. The red dots indicated the detailed partial likelihood of deviance values, the gray lines indicated the standard error (SE), the 2 vertical dotted lines on the left and right indicated the optimal gene combination with minimum criteria and 1 − SE criteria, separately. C, LUAD patients were partitioned into low‐risk and high‐risk subgroups with median risk score as the cutoff value. Distinct survival status and time were compared in low‐risk vs high‐risk subgroups. Heatmap representation of the different expression of the determined 21 aging‐related genes in 2 risk subpopulations. D, Kaplan‐Meier survival curves stratified by distinct risk patients in the discovery cohort. E, Association of the identified risk signature with LUAD prognosis in the multivariate Cox regression model with clinical confounding factors (ie, age, sex, stage, and smoking status) taken into account
