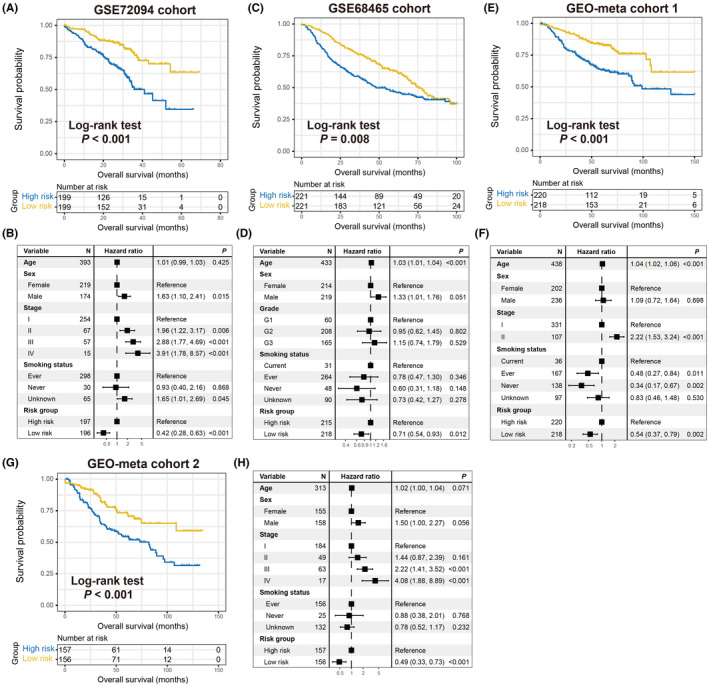
FIGURE 2.

Validation of the prognostic capacity of the constructed risk signature. Kaplan‐Meier survival curves divided into low‐risk and high‐risk LUAD subgroups in (A) GSE72094, (C) GSE68468, (E) GEO‐meta cohort 1, and (G) GEO‐meta cohort 2. Multivariate Cox models of the connections between aging risk signature and LUAD survival outcome were conducted in (B) GSE72094, (D) GSE68468, (F) GEO‐meta cohort 1, and (H) GEO‐meta cohort 2
