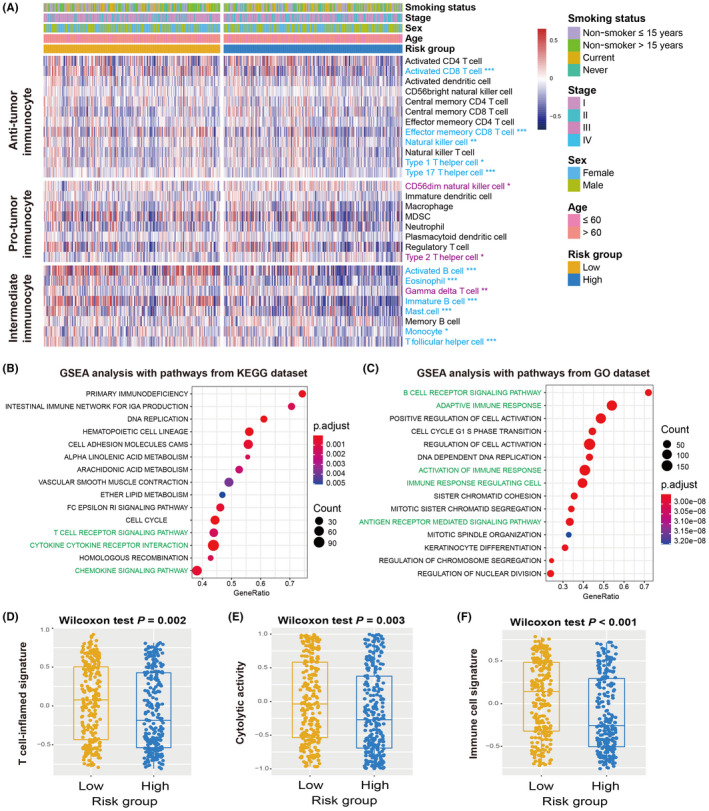
FIGURE 3.

Association of the aging risk signature with immune infiltration and immunogenicity. A, Infiltrating abundance of distinct immunocyte in low‐risk vs high‐risk LUAD subgroups. Immunocyte highlighted with blue indicated its infiltration was significantly elevated in low‐risk patients, whereas the purple indicated the infiltration was significantly decreased in low‐risk patients. GSEA analysis of low‐risk patients with annotation pathways from (B) KEGG and (C) GO databases. Pathways highlighted with green were immune response‐related pathways. Distinct enrichment distribution of (D) T cell‐inflammation signature, (E) cytolytic activity signature, and (F) immune cell signature in low‐risk and high‐risk LUAD patients. *P < .05, **P < .01, ***P < .001
