
Figure 3.
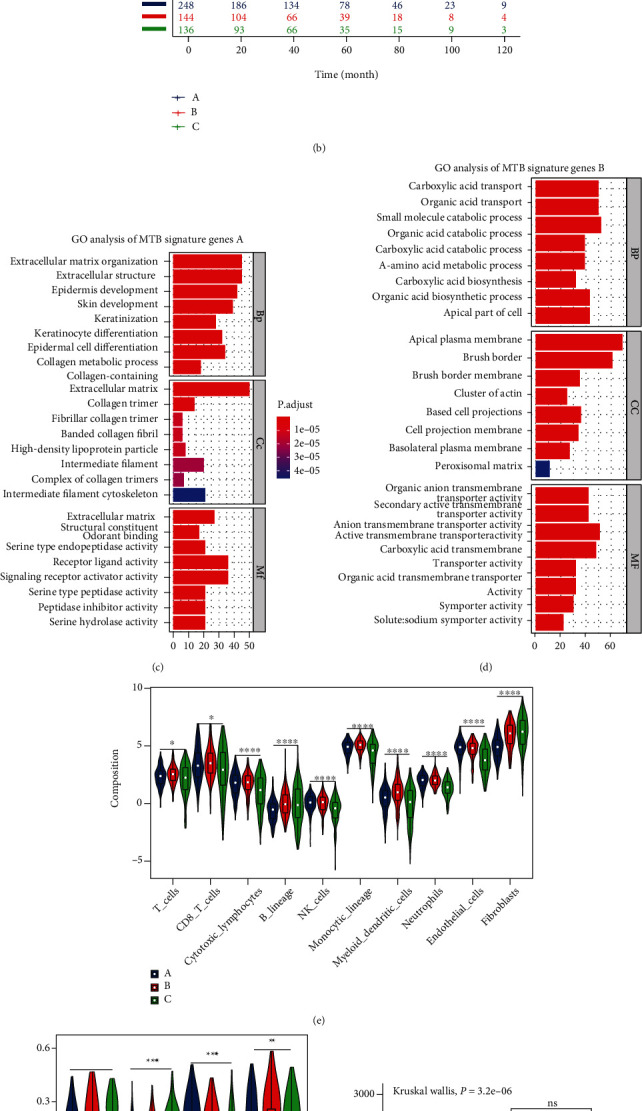
Classification of metabolic gene subclasses. (a) Consensus clustering of shared DEGs among three MTB cluster groups to classify cases into three combinations: gene clusters A–C. (b) Kaplan-Meier analysis for overall survival (OS) of the integrated dataset in three MTB gene clusters. The Log-rank p value was < 0.001, HR(B − A) = 2.3, HR(C − A) = 1.2. ((c) and (d)) Gene Ontology (GO) enrichment analysis of the two MTB-relevant signature genes: MTB signature genes A and B. The x axis represents the number of genes within per GO term. BP: biological process; CC: cellular component; MF: molecular function. ((e) and (f)) The portion of immune infiltration fractions and four ICI resistance-associated pathways in three MTB gene clusters. We also plotted the immune score and stromal score of three MTB gene clusters. ((g) and (h)) The difference in the stromal score and immune score among distinct MTB gene clusters. The Kruskal-Wallis test was applied to determine the statistical difference in three MTB gene clusters. (∗p < 0.05; ∗∗p < 0.01; ∗∗∗p < 0.001; ∗∗∗∗p < 0.0001).