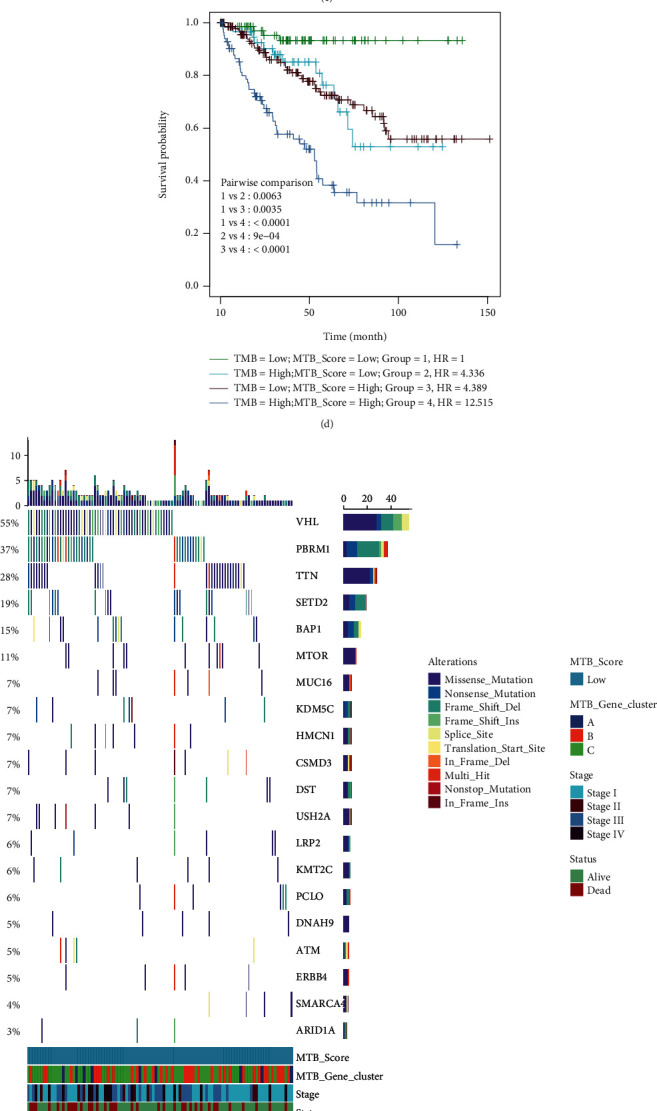
Figure 5.

The association between the MTB score and somatic mutation. (a) Variation of the MTB score among MTB gene clusters (Kruskal-Wallis test p < 0.001). (b) Scatterplots describing the positive association in the MTB scores and TMB in the TCGA set (Spearman correlation R = 0.12, p = 0.022). (c) Survival analysis for patients with high and low TMB in the TCGA RCC cohort. HR(high TMB) = 2.8, Log-rank p < 0.001. (d) Pairwise survival analysis of four groups (group 1: low TMB and low MTB score, group 2: high TMB and low MTB score, group 3: low TMB and high MTB score, group 4: high TMB and high MTB score). HR was generated by the Cox regression was group 1 as the base. ((e) and (f)) The oncoPrint plot was created with low MTB scores on the left (red) and high MTB scores on the right (red). Individual cases are depicted in the column.
