
Figure 6.
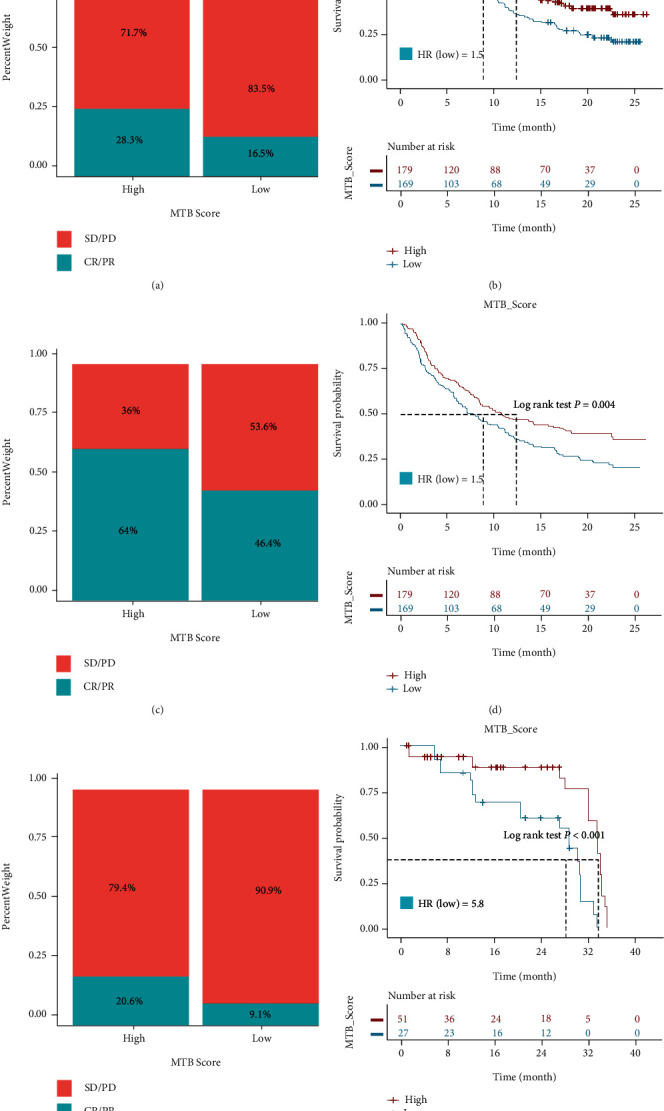
Evaluating the value of MTB scores in targeted therapy and immunotherapy. (a) Distribution of clinical response (CR: complete response; PR: partial response; and SD: stable disease; PD: progressive disease) to TKI therapy in high or low MTB score groups in the E-MTAB-3267 cohort. (b) Survival analysis for patients with high and low MTB score in the E-MTAB-3267 RCC cohort. HR(low MTB score) = 3.6, Log-rank p value < 0.001. (c) Distribution of clinical response to anti-PD-L1 therapy in high or low MTB score groups in the IMvigor210 cohort. (d) Survival analysis for patients with high and low MTB score in the IMvigor210 cohort. HR(low MTB score) = 1.5, Log-rank p = 0.004. (e) Distribution of clinical response to anti-PD-1 therapy in high or low MTB score groups in the E-MTAB-3218 RCC cohort. (f) Survival analysis for patients with high and low MTB score in the E-MTAB-3218 RCC cohort. HR(low MTB score) = 5.8, Log-rank p value < 0.001.