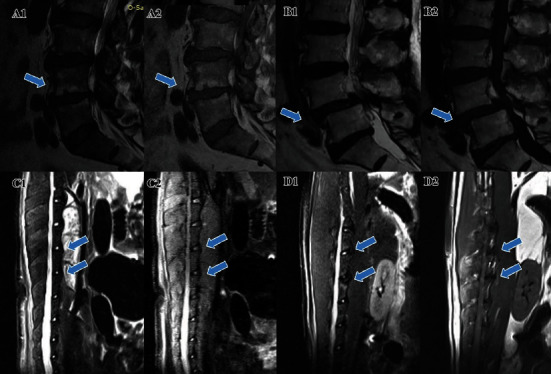
Figure 1.

Representative MR image of the MC group (A1: T2-weighted; A2: T1-weighted) and control group (B1: T2-weighted; B2: T1-weighted). Representative preoperative (C1: T2-weighted; C2: T1-weighted) and postoperative (D1: T2-weighted; D2: T1-weighted) MR image of the MC animal model. Arrows indicate the segments with MCs or C. acnes injection. MCs: Modic changes.
