Figure 6.

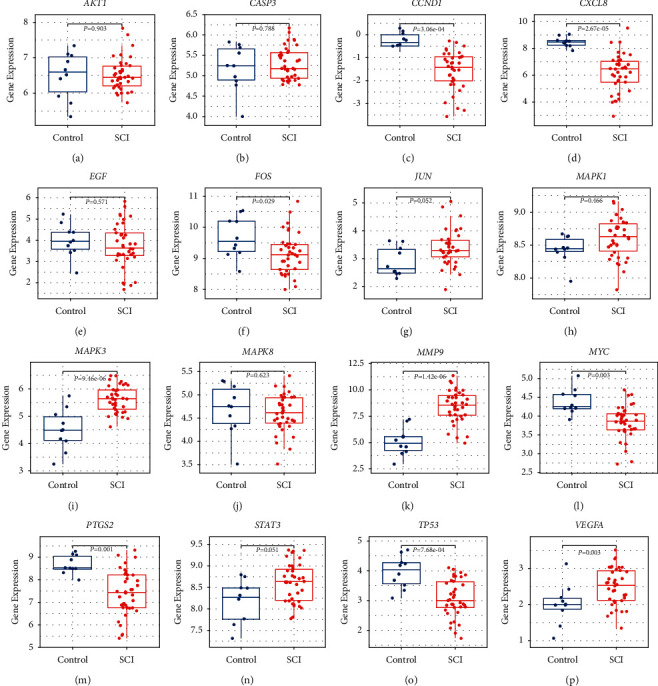
Boxplots of hub gene expression between the control group and the SCI group. (a–p) AKT1, CASP3, CCND1, CXCL8, EGF, FOS, JUN, MAPK1, MAPK3, MAPK8, MMP9, MYC, PTGS2, STAT3, TP53, and VEGFA.

Boxplots of hub gene expression between the control group and the SCI group. (a–p) AKT1, CASP3, CCND1, CXCL8, EGF, FOS, JUN, MAPK1, MAPK3, MAPK8, MMP9, MYC, PTGS2, STAT3, TP53, and VEGFA.