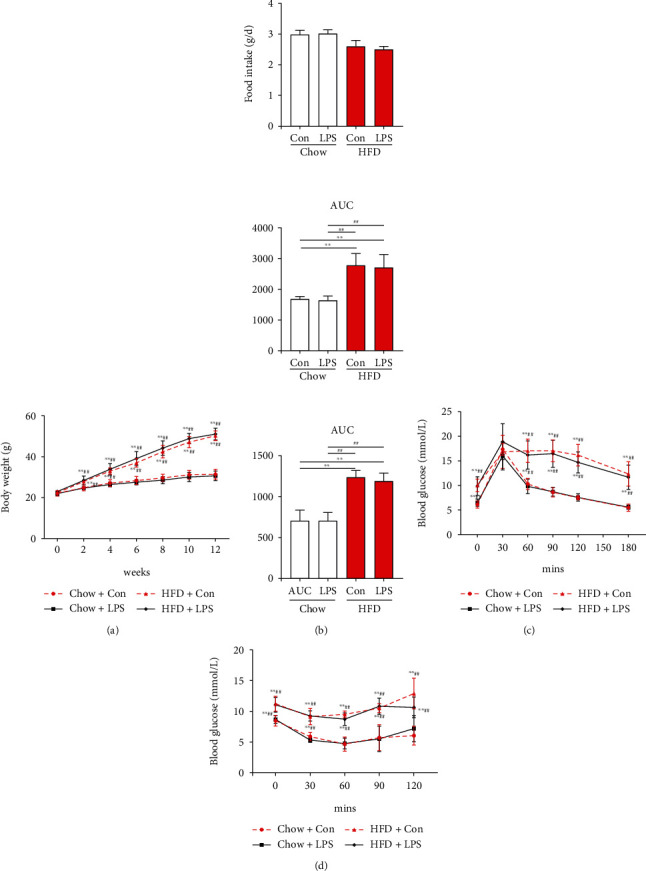
Figure 1.

Wild-type mice were challenged with a high-fat diet (HFD) for 12 weeks to induce diabetes. (a) Body weight (BW) gain over time. (b) Food intake was monitored daily for 3 d, and average daily food intake (g) was calculated. (c) Glucose tolerance test (GTT). The total insulin secretion (AUC) is calculated from (c). (d) Insulin tolerance test (ITT) and area under the curve. Each bar represents the mean ± SEM (n = 6 − 8). Compared with the chow+con group, ∗p < 0.05 and ∗∗p < 0.01. Compared with the chow+LPS group, #p < 0.05 and ##p < 0.01. One-way ANOVA with Tukey's test. Chow+con: mice on 12 weeks of the chow diet received the same volume of solvent without LPS; HDF+con: mice on 12 weeks of the HDF diet received the same volume of solvent without LPS; chow+LPS: mice on 12 weeks of the chow diet subjected to LPS (10 mg/kg, intraperitoneally) stimulation; HDF+LPS: mice on 12 weeks of the HDF diet subjected to LPS (10 mg/kg, intraperitoneally) stimulation.
