
Figure 4.
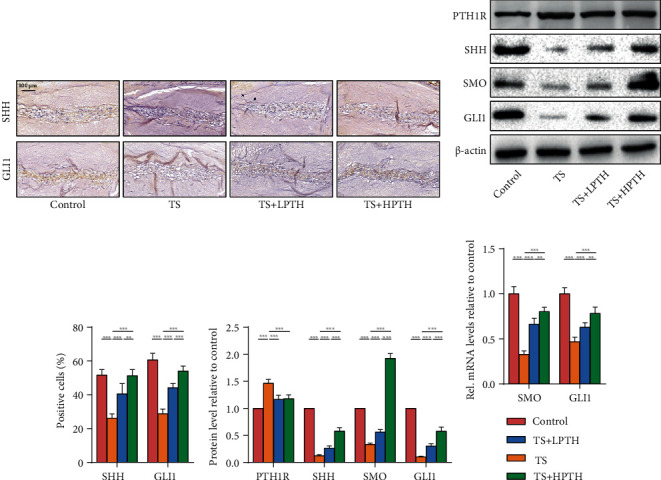
The effect of exogenous PTH on the SHH signalling pathway of the mouse intervertebral discs. (a) IHC staining of SHH and GLI1 of mouse intervertebral discs. Magnification: ×200. (b) The protein levels of PTH1R, SHH, SMO, and GLI1 of mouse intervertebral discs. (c) Quantitative analysis of IHC staining. (d) Quantitative analysis of western blot. (e) The mRNA levels of SMO and GLI1 of mouse intervertebral discs. Data are presented as mean ± SD (n = 6). ∗p < 0.05; ∗∗p < 0.01; ∗∗∗p < 0.001.