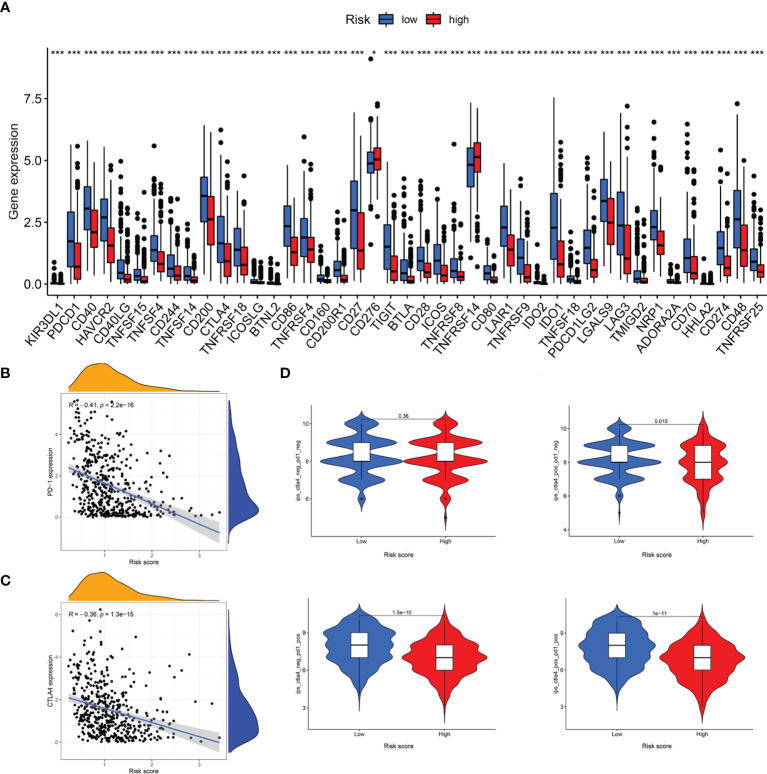
Figure 11.
Analysis of immunotherapeutic responses between different risk groups. (A) Expression of ICIs in different risk groups. (B) The correlation between risk score and PD-1 expression. (C) The correlation between risk score and CTLA4 expression. (D) IPS scoring scheme estimates the potential responses to immunotherapy in different risk groups *P < 0.05; ***P < 0.001.

