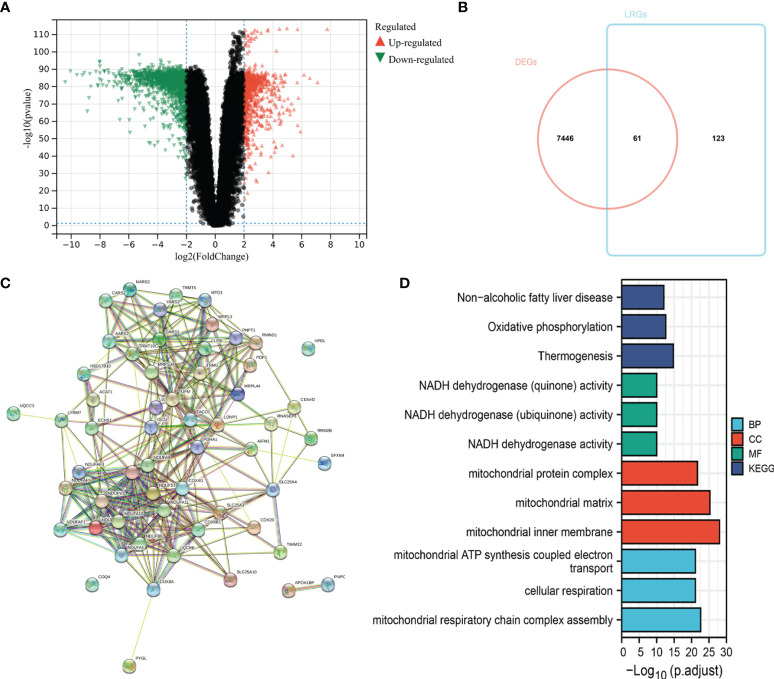
Figure 2.
Identification of differentially expressed LRGs in TCGA cohort and functional enrichment analysis. (A) Volcano plot showing the DEGs between 471 SKCM and 557 non-tumor healthy samples. (B) Venn diagram showing the intersection of DEGs and LRGs. (C) The PPI network of differentially expressed LRGs. (D) GO and KEGG analyses of differentially expressed LRGs.

